McDonalds 2012 Annual Report Download - page 38
Download and view the complete annual report
Please find page 38 of the 2012 McDonalds annual report below. You can navigate through the pages in the report by either clicking on the pages listed below, or by using the keyword search tool below to find specific information within the annual report.-
 1
1 -
2
-
3
-
4
-
5
-
6
-
7
-
8
-
9
-
10
-
11
-
12
-
13
-
14
-
15
-
16
-
17
-
18
-
19
-
20
-
21
-
22
-
23
-
24
-
25
-
26
-
27
-
 28
28 -
 29
29 -
 30
30 -
 31
31 -
 32
32 -
 33
33 -
 34
34 -
 35
35 -
 36
36 -
 37
37 -
 38
38 -
 39
39 -
 40
40 -
 41
41 -
 42
42 -
 43
43 -
 44
44 -
 45
45 -
 46
46 -
 47
47 -
 48
48 -
49
-
50
-
51
-
52
-
53
-
54
 |
 |

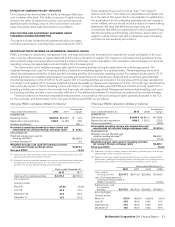
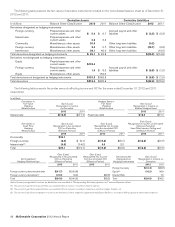
The following table presents the fair values of derivative instruments included on the Consolidated balance sheet as of December 31,
2012 and 2011:
Derivative Assets Derivative Liabilities
In millions Balance Sheet Classification 2012 2011 Balance Sheet Classification 2012 2011
Derivatives designated as hedging instruments
Foreign currency Prepaid expenses and other
current assets $ 5.0 $ 6.7 Accrued payroll and other
liabilities $ (3.5) $ (0.3)
Interest rate Prepaid expenses and other
current assets 4.2 9.4
Commodity Miscellaneous other assets 35.3 Other long-term liabilities (0.2)
Foreign currency Miscellaneous other assets 2.5 0.7 Other long-term liabilities (32.1) (0.3)
Interest rate Miscellaneous other assets 38.1 46.0 Other long-term liabilities (14.0)
Total derivatives designated as hedging instruments $ 85.1 $ 62.8 $(35.8) $(14.6)
Derivatives not designated as hedging instruments
Equity Prepaid expenses and other
current assets $132.3
Foreign currency Prepaid expenses and other
current assets 1.0 $ 8.3 Accrued payroll and other
liabilities $ (6.8) $ (1.0)
Equity Miscellaneous other assets 154.5
Total derivatives not designated as hedging instruments $133.3 $162.8 $ (6.8) $ (1.0)
Total derivatives $218.4 $225.6 $(42.6) $(15.6)
The following table presents the pretax amounts affecting income and OCI for the years ended December 31, 2012 and 2011,
respectively:
In millions
Derivatives in
Fair Value
Hedging
Relationships
Gain (Loss)
Recognized in Income
on Derivative
Hedged Items in
Fair Value
Hedging
Relationships
Gain (Loss)
Recognized in Income on
Related Hedged Items
2012 2011 2012 2011
Interest rate $(13.0) $(11.1) Fixed-rate debt $13.0 $11.1
Derivatives in
Cash Flow
Hedging
Relationships
Gain (Loss)
Recognized in Accumulated
OCI on Derivative
(Effective Portion)
Gain (Loss)
Reclassified into Income
from Accumulated OCI
(Effective Portion)
Gain (Loss)
Recognized in Income on Derivative
(Amount Excluded
from Effectiveness Testing and
Ineffective Portion)
2012 2011 2012 2011 2012 2011
Commodity $35.1
Foreign currency (6.4) $ (5.1) $(15.8) $(5.1) $(12.3) $(7.7)
Interest rate(1) (4.6) (14.0) 0.5 2.2
Total $24.1 $(19.1) $(15.3) $(2.9) $(12.3) $(7.7)
Net Investment
Hedging Relationships
Gain (Loss)
Recognized in Accumulated
OCI on Derivative
(Effective Portion)
Gain (Loss)
Reclassified into Income
from Accumulated OCI
(Effective Portion)
Derivatives Not
Designated as
Hedging Instruments
Gain (Loss)
Recognized in Income on
Derivative
2012 2011 2012 2011 2012 2011
Foreign Currency $(13.4) $(2.2)
Foreign currency denominated debt $(61.7) $(130.8) Equity(3) (16.2) 36.9
Foreign currency derivatives(2) (23.3) (9.4) $(8.2) Interest Rate 1.5
Total $(85.0) $(140.2) $(8.2) Total $(29.6) $36.2
Gains (losses) recognized in income on derivatives are recorded in “Nonoperating (income) expense, net” unless otherwise noted.
(1) The amount of gain (loss) reclassified from accumulated OCI into income is recorded in Interest expense.
(2) The amount of gain (loss) reclassified from accumulated OCI into income is recorded in Impairment and other charges (credits), net.
(3) The amount of gain (loss) recognized in income on the derivatives used to hedge the supplemental benefit plan liabilities is recorded in Selling, general & administrative expenses.
36 McDonald’s Corporation 2012 Annual Report