McDonalds 2012 Annual Report Download - page 40
Download and view the complete annual report
Please find page 40 of the 2012 McDonalds annual report below. You can navigate through the pages in the report by either clicking on the pages listed below, or by using the keyword search tool below to find specific information within the annual report.-
 1
1 -
2
-
3
-
4
-
5
-
6
-
7
-
8
-
9
-
10
-
11
-
12
-
13
-
14
-
15
-
16
-
17
-
18
-
19
-
20
-
21
-
22
-
23
-
24
-
25
-
26
-
27
-
28
-
29
-
 30
30 -
 31
31 -
 32
32 -
 33
33 -
 34
34 -
 35
35 -
 36
36 -
 37
37 -
 38
38 -
 39
39 -
 40
40 -
 41
41 -
 42
42 -
 43
43 -
 44
44 -
 45
45 -
 46
46 -
 47
47 -
 48
48 -
 49
49 -
 50
50 -
51
-
52
-
53
-
54
 |
 |

filed. Accordingly, tax liabilities are recorded when, in manage-
ment’s judgment, a tax position does not meet the more likely
than not threshold for recognition. For tax positions that meet the
more likely than not threshold, a tax liability may still be recorded
depending on management’s assessment of how the tax position
will ultimately be settled.
The Company records interest and penalties on unrecognized
tax benefits in the provision for income taxes.
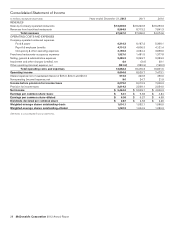
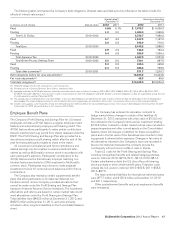
PER COMMON SHARE INFORMATION
Diluted earnings per common share is calculated using net
income divided by diluted weighted-average shares. Diluted
weighted-average shares include weighted-average shares out-
standing plus the dilutive effect of share-based compensation
calculated using the treasury stock method, of (in millions of
shares): 2012–10.1; 2011–12.8; 2010–14.3. Stock options that
were not included in diluted weighted-average shares because
they would have been antidilutive were (in millions of shares):
2012–4.7; 2011–0.0; 2010–0.0.
The Company has elected to exclude the pro forma deferred
tax asset associated with share-based compensation in earnings
per share.
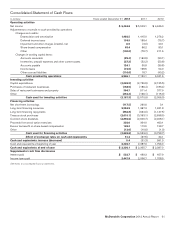
STATEMENT OF CASH FLOWS
The Company considers short-term, highly liquid investments with
an original maturity of 90 days or less to be cash equivalents.
SUBSEQUENT EVENTS
The Company evaluated subsequent events through the date the
financial statements were issued and filed with the U.S. Secu-
rities and Exchange Commission (“SEC”). There were no
subsequent events that required recognition or disclosure.
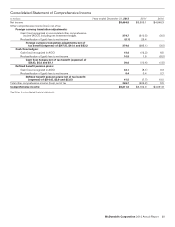
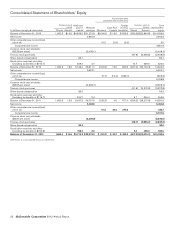
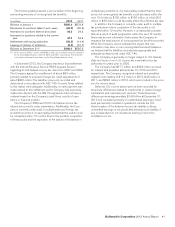
Comprehensive Income
In June 2011, the Financial Accounting Standards Board
(“FASB”) issued an update to Topic 220 – Comprehensive
Income of the Accounting Standards Codification (“ASC”). The
update is intended to increase the prominence of other compre-
hensive income in the financial statements. The guidance
requires that the Company presents components of compre-
hensive income in either one continuous statement or two
separate consecutive statements. The Company adopted this
new guidance in 2012, as required, and included a separate
Consolidated statement of comprehensive income for the years
ended December 31, 2012, 2011 and 2010.
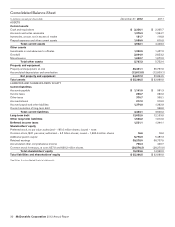
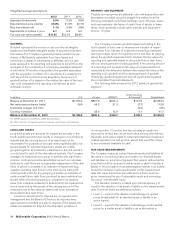
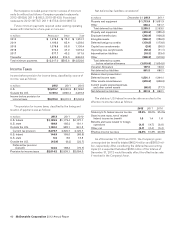
Property and Equipment
Net property and equipment consisted of:
In millions December 31, 2012 2011
Land $ 5,612.6 $ 5,328.3
Buildings and improvements
on owned land 14,089.0 13,079.9
Buildings and improvements
on leased land 12,970.8 12,021.8
Equipment, signs and
seating 5,241.0 4,757.2
Other 577.7 550.4
38,491.1 35,737.6
Accumulated depreciation
and amortization (13,813.9) (12,903.1)
Net property and equipment $ 24,677.2 $ 22,834.5
Depreciation and amortization expense was (in millions): 2012–
$1,402.2; 2011–$1,329.6; 2010–$1,200.4.
Impairment and Other Charges (Credits), Net
In millions 2012 2011 2010
Europe $6.6 $ 0.3 $ 1.6
APMEA (4.2) 48.5
Other Countries & Corporate 1.4 (21.0)
Total $8.0 $(3.9) $ 29.1
In 2010, the Company recorded expense of $29 million primarily
related to its share of restaurant closing costs in McDonald’s
Japan in conjunction with the strategic review of the market’s
restaurant portfolio, partly offset by income related to the reso-
lution of certain liabilities retained in connection with the 2007
Latin America developmental license transaction.
Other Operating (Income) Expense, Net
In millions 2012 2011 2010
Gains on sales of restaurant
businesses $(151.5) $ (81.8) $ (79.4)
Equity in earnings of
unconsolidated affiliates (143.5) (178.0) (164.3)
Asset dispositions and other
expense 43.5 26.9 45.5
Total $(251.5) $(232.9) $(198.2)
• Gains on sales of restaurant businesses
Gains on sales of restaurant businesses include gains from sales
of Company-operated restaurants. The Company’s purchases
and sales of businesses with its franchisees are aimed at achiev-
ing an optimal ownership mix in each market. Resulting gains or
losses are recorded in operating income because the trans-
actions are a recurring part of our business.
38 McDonald’s Corporation 2012 Annual Report