McDonalds 2012 Annual Report Download - page 21
Download and view the complete annual report
Please find page 21 of the 2012 McDonalds annual report below. You can navigate through the pages in the report by either clicking on the pages listed below, or by using the keyword search tool below to find specific information within the annual report.-
 1
1 -
2
-
3
-
4
-
5
-
6
-
7
-
8
-
9
-
10
-
 11
11 -
 12
12 -
 13
13 -
 14
14 -
 15
15 -
 16
16 -
 17
17 -
 18
18 -
 19
19 -
 20
20 -
 21
21 -
 22
22 -
 23
23 -
 24
24 -
 25
25 -
 26
26 -
 27
27 -
 28
28 -
 29
29 -
 30
30 -
 31
31 -
32
-
33
-
34
-
35
-
36
-
37
-
38
-
39
-
40
-
41
-
42
-
43
-
44
-
45
-
46
-
47
-
48
-
49
-
50
-
51
-
52
-
53
-
54
 |
 |

In Europe, the franchised margin percent decrease in 2012
reflected positive comparable sales and higher occupancy costs.
The increase in 2011 was primarily due to positive comparable
sales, partly offset by higher occupancy expenses.
In APMEA, the franchised margin percent decrease in 2012
was primarily due to Australia, which was partly impacted by the
2012 change in classification of certain amounts from revenues
to restaurant occupancy expenses. Although the change in
classification resulted in a decrease to the franchised margin
percentage, there was no impact on the reported franchised
margin dollars. The increase in 2011 was primarily due to a con-
tractual escalation in the royalty rate for Japan in addition to
positive comparable sales in most markets, partly offset by a
negative impact from the strengthening of the Australian dollar.
The franchised margin percent in APMEA and Other Coun-
tries & Corporate is higher relative to the U.S. and Europe due to
a larger proportion of developmental licensed and/or affiliated
restaurants where the Company receives royalty income with no
corresponding occupancy costs.
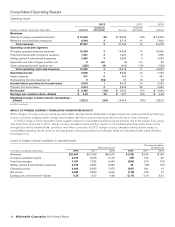
• Company-operated margins
Company-operated margin dollars represent sales by Company-
operated restaurants less the operating costs of these
restaurants. Company-operated margin dollars decreased $76
million or 2% (increased 1% in constant currencies) in 2012, and
increased $282 million or 9% (5% in constant currencies) in
2011. In 2012, Company-operated margin dollars were neg-
atively impacted by foreign currency translation of $97 million,
primarily in Europe. On a constant currency basis, the increase in
Company-operated margin dollars was due to positive perform-
ance in Europe, offset by lower results in APMEA and the U.S. as
positive comparable sales were more than offset by higher costs.
The growth in Company-operated margin dollars in 2011 was
driven by positive comparable sales partly offset by higher costs,
primarily commodity costs, in all segments. Foreign currency
translation also had a positive impact on results.
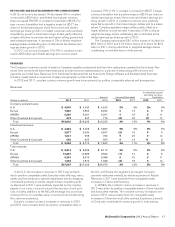
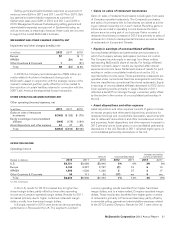
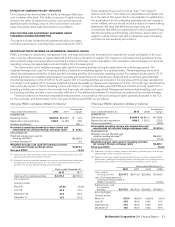
Company-operated margins
In millions 2012 2011 2010
U.S. $ 883 $ 914 $ 902
Europe 1,501 1,514 1,373
APMEA 849 876 764
Other Countries & Corporate 146 151 134
Total $3,379 $3,455 $3,173
Percent of sales
U.S. 19.5% 20.6% 21.3%
Europe 19.1 19.3 19.8
APMEA 15.9 17.3 17.8
Other Countries & Corporate 16.8 16.0 17.2
Total 18.2% 18.9% 19.6%
In the U.S., the Company-operated margin percent decreased
in 2012 primarily due to higher commodity and labor costs, partly
offset by positive comparable sales. The margin percent
decreased in 2011 due to higher commodity and occupancy
costs, partly offset by positive comparable sales.
Europe’s Company-operated margin percent decreased in
2012 primarily due to higher labor and commodity costs across
several markets, despite positive comparable sales in Russia and
the U.K. The margin percent decreased in 2011 as higher
commodity, labor, and occupancy costs were partly offset by pos-
itive comparable sales.
In APMEA, the Company-operated margin percent in 2012
decreased primarily due to higher labor and occupancy costs,
partly offset by positive comparable sales. The margin percent
decreased in 2011 as higher commodity, labor and occupancy
costs were partly offset by positive comparable sales. Accel-
eration of new restaurant openings in China negatively impacted
the margin percent in both periods. Similar to other markets, new
restaurants in China initially open with lower margins that grow
significantly over time.
Supplemental information regarding Company-
operated restaurants
We continually review our restaurant ownership mix with a goal of
improving local relevance, profits and returns. In most cases,
franchising is the best way to achieve these goals, but as pre-
viously stated, Company-operated restaurants are also important
to our success.
We report results for Company-operated restaurants based
on their sales, less costs directly incurred by that business includ-
ing occupancy costs. We report the results for franchised
restaurants based on franchised revenues, less associated occu-
pancy costs. For this reason and because we manage our
business based on geographic segments and not on the basis of
our ownership structure, we do not specifically allocate selling,
general and administrative expenses and other operating
(income) expenses to Company-operated or franchised restau-
rants. Other operating items that relate to the Company-operated
restaurants generally include gains/losses on sales of restaurant
businesses and write-offs of equipment and leasehold improve-
ments.
We believe the following information about Company-
operated restaurants in our most significant segments provides
an additional perspective on this business. Management of the
Company considers this information when evaluating restaurant
ownership mix, subject to other relevant considerations.
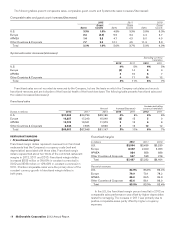
The following table seeks to illustrate the two components of
our Company-operated margins. The first of these relates
exclusively to restaurant operations, which we refer to as “Store
operating margin.” The second relates to the value of our brand
and the real estate interest we retain for which we charge rent
and royalties. We refer to this component as “Brand/real estate
margin.” Both Company-operated and conventional franchised
restaurants are charged rent and royalties, although rent and
royalties for Company-operated restaurants are eliminated in
consolidation. Rent and royalties for both restaurant ownership
types are based on a percentage of sales, and the actual rent
percentage varies depending on the level of McDonald’s invest-
ment in the restaurant. Royalty rates may also vary by market.
As shown in the following table, in disaggregating the compo-
nents of our Company-operated margins, certain costs
with respect to Company-operated restaurants are reflected in
Brand/real estate margin. Those costs consist of rent payable by
McDonald’s to third parties on leased sites and depreciation for
buildings and leasehold improvements and constitute a portion of
occupancy & other operating expenses recorded in the Con-
solidated statement of income. Store operating margins reflect
rent and royalty expenses, and those amounts are accounted for
as income in calculating Brand/real estate margin.
McDonald’s Corporation 2012 Annual Report 19