McDonalds 2012 Annual Report Download - page 14
Download and view the complete annual report
Please find page 14 of the 2012 McDonalds annual report below. You can navigate through the pages in the report by either clicking on the pages listed below, or by using the keyword search tool below to find specific information within the annual report.-
 1
1 -
2
-
3
-
 4
4 -
 5
5 -
 6
6 -
 7
7 -
 8
8 -
 9
9 -
 10
10 -
 11
11 -
 12
12 -
 13
13 -
 14
14 -
 15
15 -
 16
16 -
 17
17 -
 18
18 -
 19
19 -
 20
20 -
 21
21 -
 22
22 -
 23
23 -
 24
24 -
25
-
26
-
27
-
28
-
29
-
30
-
31
-
32
-
33
-
34
-
35
-
36
-
37
-
38
-
39
-
40
-
41
-
42
-
43
-
44
-
45
-
46
-
47
-
48
-
49
-
50
-
51
-
52
-
53
-
54
 |
 |
(numerator) by the cash used for investing activities
(denominator), primarily capital expenditures. The calculation
uses a constant average foreign exchange rate over the peri-
ods included in the calculation.
STRATEGIC DIRECTION AND FINANCIAL PERFORMANCE
The strength of the alignment between the Company, its franchi-
sees and suppliers (collectively referred to as the “System”) has
been key to McDonald’s success. This business model enables
McDonald’s to consistently deliver locally-relevant restaurant
experiences to customers and be an integral part of the commun-
ities we serve. In addition, it facilitates our ability to identify,
implement and scale innovative ideas that meet customers’
changing needs and preferences.
McDonald’s customer-focused Plan to Win (“Plan”) provides a
common framework for our global business while allowing for
local adaptation. Through the execution of multiple initiatives
surrounding the five pillars of our Plan—People, Products, Place,
Price and Promotion—we have enhanced the restaurant experi-
ence for customers worldwide and grown global comparable
sales and guest counts in each of the last nine years. This Plan,
combined with financial discipline, has delivered strong results for
our shareholders since its inception. To measure our perform-
ance as we continue to build the business, we have the following
long-term, average annual constant currency financial targets:
• Systemwide sales growth of 3% to 5%;
• Operating income growth of 6% to 7%;
• ROIIC in the high teens.
Prior to 2012, we exceeded each of these financial targets
every year since the Plan’s implementation in 2003, after adjust-
ing for the loss in 2007 from the Latin America developmental
license transaction. These targets have enabled us to make the
best decisions for the long-term benefit of our shareholders, and
we believe they remain realistic and sustainable for a company of
our size.
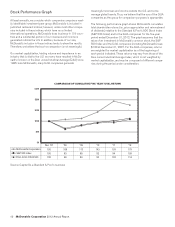
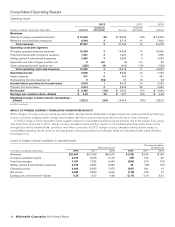
In 2012, Systemwide sales growth was 3% (5% in constant
currencies), operating income growth was 1% (4% in constant
currencies), one-year ROIIC was 15.4% and three-year ROIIC
was 28.6% (see reconciliation on page 27). Persistent global
economic headwinds, heightened competitive activity and infla-
tionary costs impacted results. In addition, planned strategic
decisions, such as the 2012 London Olympics sponsorship,
investing in technology and the biennial Worldwide Owner/
Operator convention, also impacted results.
In 2012, we continued to focus on customers’ needs and
remained aligned on our Plan and the three global growth prior-
ities of optimizing our menu, modernizing the customer
experience, and broadening accessibility to our brand. We believe
these priorities are relevant and actionable, and combined with
our competitive advantages, will drive long-term sustainable
growth. Initiatives supporting these priorities resonated with cus-
tomers and drove increases in global comparable sales and guest
counts of 3.1% and 1.6%, respectively, despite challenging
economies and a relatively flat or declining Informal Eating Out
(“IEO”) segment in most markets. In 2012, we continued to grow
market share in the U.S., Europe and APMEA, amid a more
competitive global environment and a slight decline in our fourth
quarter comparable guest counts.
Comparable sales are impacted by guest counts, product mix
shifts and menu pricing. Specific menu pricing actions across our
system reflect local market conditions as well as other factors,
notably food away from home and food at home inflation indices.
In our Company-operated restaurants, we manage menu board
prices to ensure value at all price points, increase profitability and
mitigate inflation, all while trying to grow guest counts. In order to
accomplish these objectives, we utilize a strategic pricing tool
that balances price and product mix. Franchisees also have
access to, and many utilize, this strategic pricing tool. In general,
we believe franchisees employ a similar pricing strategy. We look
to optimize product mix by utilizing a menu with entry-point value,
core, premium and promotional offerings. We also introduce new
products to meet customers’ needs, which can expand average
check and increase guest counts. In 2012, average prices
increased at Company-operated restaurants in each area of the
world, although increases varied by market and region.
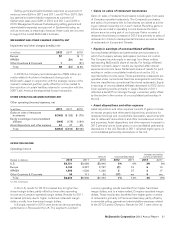
U.S.
In the U.S., comparable sales increased for the tenth consecutive
year, rising 3.3% in 2012, while comparable guest counts rose
1.9%. These results were achieved despite only modest growth
in the IEO segment and heightened competitive activity. In the
second half of the year, we experienced softer performance;
therefore, we adjusted our plans to re-energize our all-day every-
day value offerings while providing the menu variety customers
expect from McDonald’s.
In 2012, we continued to highlight beverages, value, break-
fast, and our classic core favorites. We expanded our McCafé
beverage offerings with the Chocolate Chip Frappé and Cherry
Berry Chiller. Limited-time offers, such as Chicken McBites and
the Cheddar Bacon Onion premium sandwiches, complemented
our core menu offerings.
Modernizing the customer experience continued through our
major remodeling initiative, which provides contemporary restau-
rant designs and retailing efforts. The enhanced appearance and
functionality of our restaurants deliver a more relevant experience
for our customers. Over 900 existing restaurants were remodeled
during 2012 with the majority adding drive-thru capacity to cap-
ture additional guest counts.
We broadened the accessibility of our convenient locations
through extended hours and efficient drive-thru service. More
than half of our restaurants use some form of multiple order
points to maximize drive-thru capacity, including 1,500 with hand-
held order takers to help improve customer service times. To
further build on our competitive advantage, we focused on oper-
ations excellence initiatives to drive customer satisfaction as we
strive to deliver fast, accurate and friendly service with every
order.
Europe
In Europe, comparable sales rose 2.4%, marking the ninth
consecutive year of comparable sales increases, while guest
counts declined 0.5%. While low consumer confidence continues
to negatively affect overall retail sales and the IEO segment, we
outperformed the market and grew market share. Major contrib-
utors to comparable sales were the U.K. and Russia. Despite
ongoing economic challenges, the segment’s priority remains
growing the overall business by balancing a strong focus on our
unique value offerings, ongoing premium product innovation, and
new products.
Europe continued to see the benefit of providing a relevant,
contemporary customer experience and completed almost
12 McDonald’s Corporation 2012 Annual Report