McDonalds 2012 Annual Report Download - page 18
Download and view the complete annual report
Please find page 18 of the 2012 McDonalds annual report below. You can navigate through the pages in the report by either clicking on the pages listed below, or by using the keyword search tool below to find specific information within the annual report.-
 1
1 -
2
-
3
-
4
-
5
-
6
-
7
-
 8
8 -
 9
9 -
 10
10 -
 11
11 -
 12
12 -
 13
13 -
 14
14 -
 15
15 -
 16
16 -
 17
17 -
 18
18 -
 19
19 -
 20
20 -
 21
21 -
 22
22 -
 23
23 -
 24
24 -
 25
25 -
 26
26 -
 27
27 -
 28
28 -
29
-
30
-
31
-
32
-
33
-
34
-
35
-
36
-
37
-
38
-
39
-
40
-
41
-
42
-
43
-
44
-
45
-
46
-
47
-
48
-
49
-
50
-
51
-
52
-
53
-
54
 |
 |

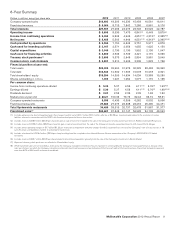
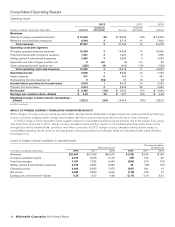
Consolidated Operating Results
Operating results
2012 2011 2010
Dollars in millions, except per share data Amount
Increase/
(decrease) Amount Increase/
(decrease) Amount
Revenues
Sales by Company-operated restaurants $ 18,603 2% $ 18,293 13% $ 16,233
Revenues from franchised restaurants 8,964 3 8,713 11 7,842
Total revenues 27,567 2 27,006 12 24,075
Operating costs and expenses
Company-operated restaurant expenses 15,224 3 14,838 14 13,060
Franchised restaurants-occupancy expenses 1,527 3 1,481 8 1,378
Selling, general & administrative expenses 2,455 3 2,394 3 2,333
Impairment and other charges (credits), net 8nm (4) nm 29
Other operating (income) expense, net (252) (8) (233) (18) (198)
Total operating costs and expenses 18,962 3 18,476 11 16,602
Operating income 8,605 1 8,530 14 7,473
Interest expense 517 5 493 9 451
Nonoperating (income) expense, net 9 (64) 25 13 22
Income before provision for income taxes 8,079 1 8,012 14 7,000
Provision for income taxes 2,614 4 2,509 22 2,054
Net income $ 5,465 (1%) $ 5,503 11% $ 4,946
Earnings per common share—diluted $ 5.36 2% $ 5.27 15% $ 4.58
Weighted-average common shares outstanding—
diluted 1,020.2 (2%) 1,044.9 (3%) 1,080.3
nm Not meaningful
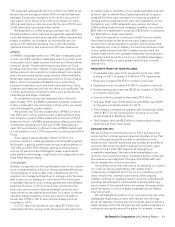
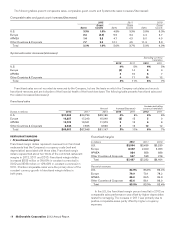
IMPACT OF FOREIGN CURRENCY TRANSLATION ON REPORTED RESULTS
While changes in foreign currency exchange rates affect reported results, McDonald’s mitigates exposures, where practical, by financing
in local currencies, hedging certain foreign-denominated cash flows, and purchasing goods and services in local currencies.
In 2012, foreign currency translation had a negative impact on consolidated operating results primarily due to the weaker Euro, along
with most other currencies. In 2011, foreign currency translation had a positive impact on consolidated operating results driven by the
stronger Euro and Australian Dollar, as well as most other currencies. In 2010, foreign currency translation had a positive impact on
consolidated operating results driven by stronger global currencies, primarily the Australian Dollar and Canadian Dollar, partly offset by
the weaker Euro.
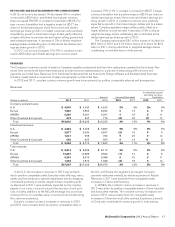
Impact of foreign currency translation on reported results
Reported amount Currency translation
benefit/(cost)
In millions, except per share data 2012 2011 2010 2012 2011 2010
Revenues $27,567 $27,006 $24,075 $ (726) $ 944 $ 188
Company-operated margins 3,379 3,455 3,173 (97) 134 35
Franchised margins 7,437 7,232 6,464 (204) 213 (14)
Selling, general & administrative expenses 2,455 2,394 2,333 40 (55) (12)
Operating income 8,605 8,530 7,473 (261) 301 13
Net income 5,465 5,503 4,946 (178) 195 13
Earnings per common share—diluted 5.36 5.27 4.58 (0.17) 0.19 0.01
16 McDonald’s Corporation 2012 Annual Report