McDonalds 2012 Annual Report Download - page 44
Download and view the complete annual report
Please find page 44 of the 2012 McDonalds annual report below. You can navigate through the pages in the report by either clicking on the pages listed below, or by using the keyword search tool below to find specific information within the annual report.-
 1
1 -
2
-
3
-
4
-
5
-
6
-
7
-
8
-
9
-
10
-
11
-
12
-
13
-
14
-
15
-
16
-
17
-
18
-
19
-
20
-
21
-
22
-
23
-
24
-
25
-
26
-
27
-
28
-
29
-
30
-
31
-
32
-
33
-
 34
34 -
 35
35 -
 36
36 -
 37
37 -
 38
38 -
 39
39 -
 40
40 -
 41
41 -
 42
42 -
 43
43 -
 44
44 -
 45
45 -
 46
46 -
 47
47 -
 48
48 -
 49
49 -
 50
50 -
 51
51 -
 52
52 -
 53
53 -
 54
54
 |
 |

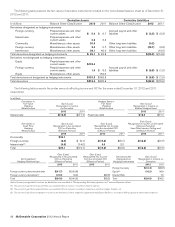
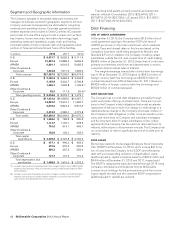
Segment and Geographic Information
The Company operates in the global restaurant industry and
manages its business as distinct geographic segments. All inter-
company revenues and expenses are eliminated in computing
revenues and operating income. Corporate general and admin-
istrative expenses are included in Other Countries & Corporate
and consist of home office support costs in areas such as facili-
ties, finance, human resources, information technology, legal,
marketing, restaurant operations, supply chain and training.
Corporate assets include corporate cash and equivalents, asset
portions of financial instruments and home office facilities.
In millions 2012 2011 2010
U.S. $ 8,813.7 $ 8,528.2 $ 8,111.6
Europe 10,827.4 10,886.4 9,569.2
APMEA 6,391.1 6,019.5 5,065.5
Other Countries &
Corporate 1,534.8 1,571.9 1,328.3
Total revenues $27,567.0 $27,006.0 $24,074.6
U.S. $ 3,750.4 $ 3,666.2 $ 3,446.5
Europe 3,195.8 3,226.7 2,796.8
APMEA 1,566.1 1,525.8 1,199.9(1)
Other Countries &
Corporate 92.3 111.0 29.9(2)
Total operating income $ 8,604.6 $ 8,529.7 $ 7,473.1
U.S. $11,431.6 $10,865.5 $10,467.7
Europe 14,223.3 12,015.1 11,360.7
APMEA 6,419.3 5,824.2 5,374.0
Other Countries &
Corporate 3,312.3 4,285.1 4,772.8
Total assets $35,386.5 $32,989.9 $31,975.2
U.S. $ 1,065.0 $ 786.5 $ 530.5
Europe 1,114.7 1,130.1 978.5
APMEA 716.6 614.1 493.1
Other Countries &
Corporate 152.9 199.1 133.4
Total capital
expenditures $ 3,049.2 $ 2,729.8 $ 2,135.5
U.S. $ 477.1 $ 446.0 $ 433.0
Europe 573.5 570.3 500.5
APMEA 296.2 267.5 232.4
Other Countries &
Corporate 141.7 131.2 110.3
Total depreciation and
amortization $ 1,488.5 $ 1,415.0 $ 1,276.2
(1) Includes expense due to Impairment and other charges (credits), net of $39.3 million
related to the Company’s share of restaurant closings in McDonald’s Japan (a 50%-
owned affiliate).
(2) Includes income due to Impairment and other charges (credits), net of $21.0 million
related to the resolution of certain liabilities retained in connection with the 2007
Latin America developmental license transaction.
Total long-lived assets, primarily property and equipment,
were (in millions)–Consolidated: 2012–$29,644.5; 2011–
$27,587.6; 2010–$26,700.9; U.S. based: 2012–$11,308.7;
2011–$10,724.9; 2010–$10,430.2.
Debt Financing
LINE OF CREDIT AGREEMENTS
At December 31, 2012, the Company had a $1.5 billion line of
credit agreement expiring in November 2016 with fees of
0.065% per annum on the total commitment, which remained
unused. Fees and interest rates on this line are based on the
Company’s long-term credit rating assigned by Moody’s and
Standard & Poor’s. In addition, the Company, including certain
subsidiaries outside the U.S., had unused lines of credit totaling
$988.9 million at December 31, 2012; these lines of credit were
primarily uncommitted, short-term and denominated in various
currencies at local market rates of interest.
The weighted-average interest rate of short-term borrowings
was 4.1% at December 31, 2012 (based on $581.3 million of
foreign currency bank line borrowings and $200.0 million of
commercial paper) and 4.6% at December 31, 2011 (based on
$640.3 million of foreign currency bank line borrowings and
$250.0 million of commercial paper).
DEBT OBLIGATIONS
The Company has incurred debt obligations principally through
public and private offerings and bank loans. There are no provi-
sions in the Company’s debt obligations that would accelerate
repayment of debt as a result of a change in credit ratings or a
material adverse change in the Company’s business. Certain of
the Company’s debt obligations contain cross-acceleration provi-
sions, and restrictions on Company and subsidiary mortgages
and the long-term debt of certain subsidiaries. Under certain
agreements, the Company has the option to retire debt prior to
maturity, either at par or at a premium over par. The Company has
no current plans to retire a significant amount of its debt prior to
maturity.
ESOP LOANS
Borrowings related to the leveraged Employee Stock Ownership
Plan (“ESOP”) at December 31, 2012, which include $31.5 mil-
lion of loans from the Company to the ESOP, are reflected as
debt with a corresponding reduction of shareholders’ equity
(additional paid-in capital included a balance of $27.2 million and
$34.4 million at December 31, 2012 and 2011, respectively).
The ESOP is repaying the loans and interest through 2018 using
Company contributions and dividends from its McDonald’s
common stock holdings. As the principal amount of the borrow-
ings is repaid, the debt and the unearned ESOP compensation
(additional paid-in capital) are reduced.
42 McDonald’s Corporation 2012 Annual Report