Microsoft 2006 Annual Report Download - page 22
Download and view the complete annual report
Please find page 22 of the 2006 Microsoft annual report below. You can navigate through the pages in the report by either clicking on the pages listed below, or by using the keyword search tool below to find specific information within the annual report.-
 1
1 -
2
-
3
-
4
-
5
-
6
-
7
-
8
-
9
-
10
-
11
-
 12
12 -
 13
13 -
 14
14 -
 15
15 -
 16
16 -
 17
17 -
 18
18 -
 19
19 -
 20
20 -
 21
21 -
 22
22 -
 23
23 -
 24
24 -
 25
25 -
 26
26 -
 27
27 -
 28
28 -
 29
29 -
 30
30 -
 31
31 -
 32
32 -
33
-
34
-
35
-
36
-
37
-
38
-
39
-
40
-
41
-
42
-
43
-
44
-
45
-
46
-
47
-
48
-
49
-
50
-
51
-
52
-
53
-
54
-
55
-
56
-
57
-
58
-
59
-
60
-
61
-
62
-
63
-
64
-
65
-
66
-
67
-
68
-
69
-
70
-
71
-
72
-
73
 |
 |

PAGE 21
As open source software development and distribution evolves, we continue to seek to differentiate our products from
competing products that are based on open source software. We believe that Microsoft’s share of server unit operating systems
increased in fiscal year 2006.
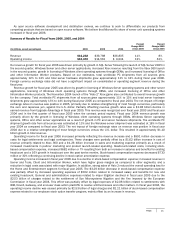
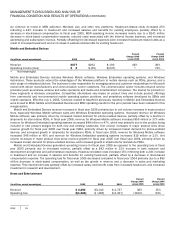
Summary of Results for Fiscal Years 2006, 2005, and 2004
(In millions, except percentages) 2006
2005
2004
Percent
Change 2006
versus 2005
Percent
Change 2005
versus 2004
Revenue $44,282
$39,788
$36,835 11%
8%
Operating income $16,472
$14,561
$ 9,034 13%
61%
Our revenue growth for fiscal year 2006 was driven primarily by growth in SQL Server following the launch of SQL Server 2005 in
the second quarter, Windows Server and other server applications, increased Xbox revenue resulting from the Xbox 360 launch
in the second quarter, growth in licensing of Windows client operating systems through OEMs, and increased licensing of Office
and other Information Worker products. Based on our estimates, total worldwide PC shipments from all sources grew
approximately 12% to 14% and total server hardware shipments grew approximately 11% to 13% during fiscal year 2006.
Foreign currency exchange rates did not have a significant impact on consolidated or operating segment revenue during the
fiscal year.
Revenue growth for fiscal year 2005 was driven by growth in licensing of Windows Server operating systems and other server
applications, licensing of Windows client operating systems through OEMs, and increased licensing of Office and other
Information Worker products. The November 2004 launch of the “Halo 2” Xbox game also contributed to overall revenue growth
for the company. Total worldwide PC shipments from all sources grew approximately 11% to 13% and total server hardware
shipments grew approximately 13% to 14% during fiscal year 2005 as compared to fiscal year 2004. The net impact of foreign
exchange rates on revenue was positive in 2005, primarily due to relative strengthening of most foreign currencies, particularly
the euro and Japanese yen, against the U.S. dollar. Partially offsetting revenue growth rates was a $1.08 billion decline in
earned revenue from Upgrade Advantage in fiscal year 2005. This revenue was recognized over fiscal year 2003 and fiscal year
2004 and in the first quarter of fiscal year 2005 when the contract period expired. Fiscal year 2004 revenue growth was
primarily driven by the growth in licensing of Windows client operating systems through OEMs, Windows Server operating
systems, Office and other server applications as a result of growth in PC and server hardware shipments. The worldwide PC
shipment growth rate from all sources was estimated at 13% and the Windows server shipment was estimated at 18% in fiscal
year 2004 as compared to fiscal year 2003. The net impact of foreign exchange rates on revenue was positive in fiscal year
2004 due to a relative strengthening of most foreign currencies versus the U.S. dollar. This resulted in approximately $1.10
billion growth in total revenue.
Operating income for fiscal year 2006 increased primarily reflecting the revenue increase and a $991 million decrease in
costs for legal settlements and legal contingencies. These changes were partially offset by a $1.62 billion increase in cost of
revenue primarily related to Xbox 360 and a $1.26 billion increase in sales and marketing expense primarily as a result of
increased investments in partner marketing and product launch-related spending. Headcount-related costs, including stock-
based compensation expense, increased $682 million or 7% resulting from both an increase in salaries and benefits for existing
headcount and a 16% growth in headcount over the past twelve months. Stock-based compensation expense decreased $733
million or 30% reflecting a continuing decline in stock option amortization expense.
Operating income increased in fiscal year 2005 due to a decline in stock-based compensation expense; increased revenue in
Server and Tools, Client and Information Worker, which have higher gross margins as compared to other segments; and a
reduction in legal costs associated with major litigation. In addition, strong sales of Halo 2 reduced the overall operating loss for
the Home and Entertainment segment for fiscal year 2005. The $3.29 billion decrease in stock-based compensation expense
was partially offset by increased operating expenses of $562 million related to increased salary and benefits for new and
existing headcount. General and administrative expenses related to major litigation declined in fiscal year 2005 due to the
$2.53 billion of charges related to the settlement of Sun Microsystems litigation and the fine imposed by the European
Commission in fiscal year 2004. This effect was partially offset by legal expenses of $2.08 billion related to settlements with
IBM, Novell, Gateway, and end-user class action plaintiffs to resolve antitrust issues and other matters. In fiscal year 2004, the
operating income decline was caused primarily by $2.53 billion of legal charges and $2.21 billion of stock-based compensation
expense related to our employee stock option transfer program, mainly offset by an increase in revenue.