Microsoft 2006 Annual Report Download - page 52
Download and view the complete annual report
Please find page 52 of the 2006 Microsoft annual report below. You can navigate through the pages in the report by either clicking on the pages listed below, or by using the keyword search tool below to find specific information within the annual report.-
 1
1 -
2
-
3
-
4
-
5
-
6
-
7
-
8
-
9
-
10
-
11
-
12
-
13
-
14
-
15
-
16
-
17
-
18
-
19
-
20
-
21
-
22
-
23
-
24
-
25
-
26
-
27
-
28
-
29
-
30
-
31
-
32
-
33
-
34
-
35
-
36
-
37
-
38
-
39
-
40
-
41
-
 42
42 -
 43
43 -
 44
44 -
 45
45 -
 46
46 -
 47
47 -
 48
48 -
 49
49 -
 50
50 -
 51
51 -
 52
52 -
 53
53 -
 54
54 -
 55
55 -
 56
56 -
 57
57 -
 58
58 -
 59
59 -
 60
60 -
 61
61 -
 62
62 -
63
-
64
-
65
-
66
-
67
-
68
-
69
-
70
-
71
-
72
-
73
 |
 |

PAGE 51
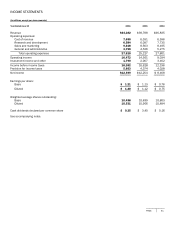
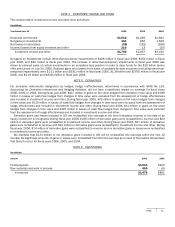
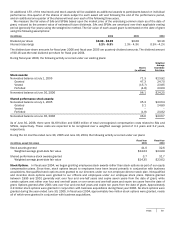
NOTE 4 INVESTMENT INCOME AND OTHER
The components of investment income and other were as follows:
(In millions)
Y
ear Ended June 30
2006
2005
2004
Dividends and in
t
erest
$1,510
$1,460
$1,892
Net gains on investments
16
1
856
1,563
Net losses on derivatives
(99) (262)
(268)
Income/(losses) from equity investees and other
218
13
(25)
Investment income and other
$1,790
$2,067
$3,162
Net gains on investments include other-than-temporary impairments of $408 million in fiscal year 2006, $152 million in fiscal
year 2005, and $82 million in fiscal year 2004. The increase in other-than-temporary impairments in fiscal year 2006 was
driven by planned sales of certain investments in an unrealized loss position in order to raise funds for the $20 billion tender
offer announced on July 20, 2006. Realized gains and (losses) from sales of available-for-sale securities (excluding other-than-
temporary impairments) were $1.11 billion and $(531) million in fiscal year 2006, $1.38 billion and $(376) million in fiscal year
2005, and $2.16 billion and $(518) million in fiscal year 2004.
NOTE 5 DERIVATIVES
For derivative instruments designated as hedges, hedge ineffectiveness, determined in accordance with SFAS No. 133,
Accounting for Derivative Instruments and Hedging Activities, did not have a significant impact on earnings for fiscal years
2006, 2005, or 2004. During fiscal year 2006, $217 million in gains on fair value hedges from changes in time value and $399
million in losses on cash flow hedges from changes in time value were excluded from the assessment of hedge effectiveness
and included in investment income and other. During fiscal year 2005, $79 million in gains on fair value hedges from changes
in time value and $116 million in losses on cash flow hedges from changes in time value were excluded from the assessment of
hedge effectiveness and included in investment income and other. During fiscal year 2004, $31 million in gains on fair value
hedges from changes in time value and $325 million in losses on cash flow hedges from changes in time value were excluded
from the assessment of hedge effectiveness and included in investment income and other.
Derivative gains and losses included in OCI are reclassified into earnings at the time forecasted revenue or the sale of an
equity investment is recognized. During fiscal year 2006, $166 million of derivative gains were reclassified to revenue and $23
million in derivative gains were reclassified to investment income and other. During fiscal year 2005, $57 million of derivative
gains were reclassified to revenue and $33 million in derivative gains were reclassified to investment income and other. During
fiscal year 2004, $14 million of derivative gains were reclassified to revenue and no derivative gains or losses were reclassified
to investment income and other.
We estimate that $133 million of net derivative gains included in OCI will be reclassified into earnings within the next 12
months. No significant amounts of gains or losses were reclassified from OCI into earnings as a result of forecasted transactions
that failed to occur for fiscal years 2006, 2005, and 2004.
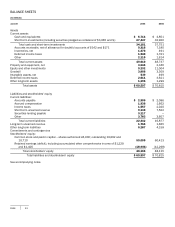
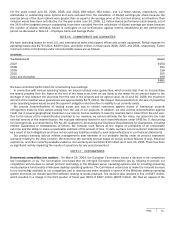
NOTE 6 INVENTORIES
(In millions)
June 30
2006
2005
Finished goods $1,013
$422
Raw materials and work in process 465
69
Inventories $1,478
$491