Microsoft 2006 Annual Report Download - page 40
Download and view the complete annual report
Please find page 40 of the 2006 Microsoft annual report below. You can navigate through the pages in the report by either clicking on the pages listed below, or by using the keyword search tool below to find specific information within the annual report.-
 1
1 -
2
-
3
-
4
-
5
-
6
-
7
-
8
-
9
-
10
-
11
-
12
-
13
-
14
-
15
-
16
-
17
-
18
-
19
-
20
-
21
-
22
-
23
-
24
-
25
-
26
-
27
-
28
-
29
-
 30
30 -
 31
31 -
 32
32 -
 33
33 -
 34
34 -
 35
35 -
 36
36 -
 37
37 -
 38
38 -
 39
39 -
 40
40 -
 41
41 -
 42
42 -
 43
43 -
 44
44 -
 45
45 -
 46
46 -
 47
47 -
 48
48 -
 49
49 -
 50
50 -
51
-
52
-
53
-
54
-
55
-
56
-
57
-
58
-
59
-
60
-
61
-
62
-
63
-
64
-
65
-
66
-
67
-
68
-
69
-
70
-
71
-
72
-
73
 |
 |

PAGE 39
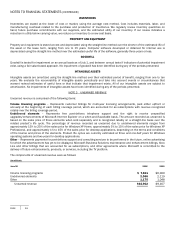
QUANTITATIVE AND QUALITATIVE DISCLOSURES ABOUT MARKET RISK
We are exposed to foreign currency, interest rate, fixed-income, equity, and commodity price risks. A portion of these risks is
hedged, but fluctuations could impact our results of operations and financial position. We hedge a portion of anticipated
revenue and accounts receivable exposure to foreign currency fluctuations, primarily with option contracts. We monitor our
foreign currency exposures daily to maximize the overall effectiveness of our foreign currency hedge positions. Principal
currencies hedged include the euro, Japanese yen, British pound, and Canadian dollar. Fixed-income securities are subject
primarily to interest rate risk. The portfolio is diversified and structured to minimize credit risk. Securities held in our equity and
other investments portfolio are subject to price risk, and are generally not hedged. However, we use options to hedge our price
risk on certain equity securities that are held primarily for strategic purposes. Commodity derivatives held for the purpose of
portfolio diversification are subject to commodity price risk.
We use a value-at-risk (“VaR”) model to estimate and quantify our market risks. VaR is the expected loss, for a given
confidence level, in fair value of our portfolio due to adverse market movements over a defined time horizon. The VaR model is
not intended to represent actual losses in fair value, but is used as a risk estimation and management tool. The model used for
currencies, equities, and commodities is geometric Brownian motion, which allows incorporation of optionality with regard to
these risk exposures. For interest rate risk, exposures such as key rate durations and spread durations are used in calculations
that reflect the principle that fixed-income security prices revert to maturity value over time.
VaR is calculated by computing the exposures of each holding’s market value to a range of over 1,000 equity, fixed-income,
foreign exchange, and commodity risk factors. The exposures are then used to compute the parameters of a distribution of
potential changes in the total market value of all holdings, taking into account the weighted historical volatilities of the different
rates and prices and the weighted historical correlations among the different rates and prices. The VaR is then calculated as the
total loss that will not be exceeded at the 97.5 percentile confidence level or, alternatively stated, the losses could exceed the
VaR in 25 out of 1,000 cases. Several risk factors are not captured in the model, including liquidity risk, operational risk, credit
risk, and legal risk.
Certain securities in our equity portfolio are held for strategic purposes. We hedge the value of a portion of these securities
through the use of derivative contracts such as put-call collars. In these arrangements, we hedge a security’s equity price risk
below the purchased put strike and forgo most or all of the benefits of the security’s appreciation above the sold call strike, in
exchange for the premium received for the sold call. We also hold equity securities for general investment return purposes. We
have incurred material impairment charges related to these securities in previous periods.
At the beginning of the second fiscal quarter of fiscal year 2006, we changed the methodology we use to calculate VaR. We
previously used a Monte Carlo simulation-based methodology to calculate VaR. In the second quarter of fiscal year 2006, we
adopted a factor-based parametric methodology. The factor-based parametric methodology can be performed more frequently
(resulting in more timely data), divides the aggregated VaR into its component risk factor groups, and is incrementally more
accurate than the previously used simulation-based methodology in evaluating diversification effects of commodity risk factors
and interactions between equity and currency factors. While we believe the efficiencies gained by changing to the parametric
methodology are significant, we do not believe this methodology produces results that are significantly different from the
simulation-based methodology.
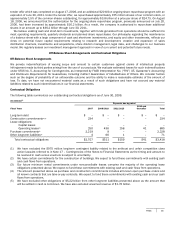
The VaR amounts disclosed below are used as a risk management tool and reflect an estimate of potential reductions in fair
value of our portfolio. Losses in fair value over the specified holding period can exceed the reported VaR by significant amounts
and can also accumulate over a longer time horizon than the specified holding period used in the VaR analysis. VaR amounts
are not necessarily reflective of potential accounting losses, including determinations of other-than-temporary losses in fair
value in accordance with U.S. GAAP.
VaR numbers are shown separately for interest rate, currency rate, equity price, and commodity price risks. These VaR
numbers include the underlying portfolio positions and related hedges. We use historical data to estimate VaR. Given the
reliance on historical data, VaR is most effective in estimating risk exposures in markets in which there are no fundamental
changes or shifts in market conditions. An inherent limitation in VaR is that the distribution of past changes in market risk
factors may not produce accurate predictions of future market risk.