Microsoft 2006 Annual Report Download - page 41
Download and view the complete annual report
Please find page 41 of the 2006 Microsoft annual report below. You can navigate through the pages in the report by either clicking on the pages listed below, or by using the keyword search tool below to find specific information within the annual report.-
 1
1 -
2
-
3
-
4
-
5
-
6
-
7
-
8
-
9
-
10
-
11
-
12
-
13
-
14
-
15
-
16
-
17
-
18
-
19
-
20
-
21
-
22
-
23
-
24
-
25
-
26
-
27
-
28
-
29
-
30
-
 31
31 -
 32
32 -
 33
33 -
 34
34 -
 35
35 -
 36
36 -
 37
37 -
 38
38 -
 39
39 -
 40
40 -
 41
41 -
 42
42 -
 43
43 -
 44
44 -
 45
45 -
 46
46 -
 47
47 -
 48
48 -
 49
49 -
 50
50 -
 51
51 -
52
-
53
-
54
-
55
-
56
-
57
-
58
-
59
-
60
-
61
-
62
-
63
-
64
-
65
-
66
-
67
-
68
-
69
-
70
-
71
-
72
-
73
 |
 |

PAGE 40
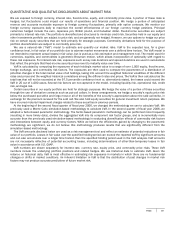
QUANTITATIVE AND QUALITATIVE DISCLOSURES ABOUT MARKET RISK (CONTINUED)
The following table sets forth the one-day VaR for substantially all of our positions as of June 30, 2006 and 2005, and for the
fiscal year ended June 30, 2006:
(In millions)
Y
ear ended June
30, 2006
Risk Categories
2006
2005
A
verage
High
Low
Interest rates
$66
$ 88
$ 82 $127
$62
Currency rates
91
52
33 9
1
1
1
Equity prices
88
164
116 168
84
Commodity prices
12
14
15 18
12
Total one-day VaR for the combined risk categories was $158 million at June 30, 2006 and $195 million at June 30, 2005.
The total VaR is 38% less at June 30, 2006 and 39% less at June, 30 2005 than the sum of the separate risk categories in the
above table due to the diversification benefit of the combination of risks.