Microsoft 2006 Annual Report Download - page 31
Download and view the complete annual report
Please find page 31 of the 2006 Microsoft annual report below. You can navigate through the pages in the report by either clicking on the pages listed below, or by using the keyword search tool below to find specific information within the annual report.-
 1
1 -
2
-
3
-
4
-
5
-
6
-
7
-
8
-
9
-
10
-
11
-
12
-
13
-
14
-
15
-
16
-
17
-
18
-
19
-
20
-
 21
21 -
 22
22 -
 23
23 -
 24
24 -
 25
25 -
 26
26 -
 27
27 -
 28
28 -
 29
29 -
 30
30 -
 31
31 -
 32
32 -
 33
33 -
 34
34 -
 35
35 -
 36
36 -
 37
37 -
 38
38 -
 39
39 -
 40
40 -
 41
41 -
42
-
43
-
44
-
45
-
46
-
47
-
48
-
49
-
50
-
51
-
52
-
53
-
54
-
55
-
56
-
57
-
58
-
59
-
60
-
61
-
62
-
63
-
64
-
65
-
66
-
67
-
68
-
69
-
70
-
71
-
72
-
73
 |
 |

PAGE 30
MANAGEMENT’S DISCUSSION AND ANALYSIS OF
FINANCIAL CONDITION AND RESULTS OF OPERATIONS (CONTINUED)
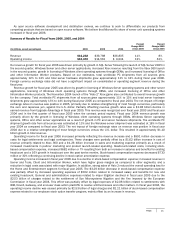
Operating Expenses
Cost of Revenue
(In millions, except percentages) 2006
2005
2004
Percent
Change 2006
versus 2005
Percent
Change 2005
versus 2004
Cost of revenue $
7,650
$6,031
$6,596
27%
(9)%
As a percent of revenue
17%
15%
18
%
2ppt
(3)ppt
Cost of revenue includes manufacturing and distribution costs for products sold and programs licensed, operating costs related
to product support service centers and product distribution centers, costs incurred to support and maintain Internet-based
products and services, and costs associated with the delivery of consulting services. Cost of revenue in fiscal year 2006
increased mainly due to a $1.64 billion increase in Home and Entertainment as a result of an increase in the number of total
Xbox consoles sold and higher Xbox 360 unit costs. Cost of revenue in fiscal year 2005 decreased due to a $363 million
decrease in stock-based compensation expense, a $140 million reduction in costs associated with a decrease in the MSN
Internet Access subscriber base, and a $169 million reduction in other product costs mainly due to Xbox consoles cost
efficiency, partially offset by increased costs in product support and consulting services costs.
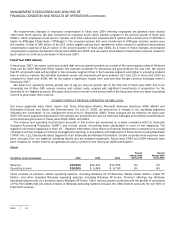
Research and Development
(In millions, except percentages) 2006
2005
2004
Percent
Change 2006
versus 2005
Percent
Change 2005
versus 2004
Research and developmen
t
$
6,584
$6,097
$7,735
8%
(21)%
As a percent of revenue
15%
15
%
21%
–ppt
(6)ppt
Research and development expenses include payroll, employee benefits, stock-based compensation expense, and other
headcount-related costs associated with product development. Research and development expenses also include third-party
development and programming costs, localization costs incurred to translate software for international markets, and the
amortization of purchased software code and services content. Research and development costs increased during fiscal year
2006 primarily due to increased development costs associated with new and upcoming offerings such as MSN adCenter, the
2007 Microsoft Office system, Windows Vista, Xbox 360, and corporate research activities. Headcount-related costs increased
3% during fiscal year 2006 reflecting both a 17% increase in headcount and an increase in salaries and benefits for existing
headcount, partially offset by a decrease in stock-based compensation expense. Our research and development expenses
decreased in fiscal year 2005 due to a $1.88 billion decrease in stock-based compensation expense. This expense decline was
partially offset by increased headcount and product development costs associated with the Xbox 360 console and related
games, SQL Server 2005, Windows Vista, and product development in Mobile and Embedded Devices.
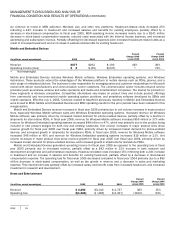
Sales and Marketing
(In millions, except percentages) 2006
2005
2004
Percent
Change 2006
versus 2005
Percent
Change 2005
versus 2004
Sales and marketin
g
$
9,818
$8,563
$8,195
15%
4%
As a percent of revenue
22%
22%
22
%
–ppt
–ppt
Sales and marketing expenses include payroll, employee benefits, stock-based compensation expense and other headcount-
related costs associated with sales and marketing personnel and advertising, promotions, trade shows, seminars, and other
programs. Sales and marketing expenses increased during fiscal year 2006 primarily due to increased headcount-related costs,
investments in partner marketing and product launch-related spending. Headcount-related costs increased 13% during fiscal
year 2006 reflecting both a 20% increase in headcount and an increase in salaries and benefits for existing headcount, partially
offset by a decrease in stock-based compensation expense.