Microsoft 2006 Annual Report Download - page 26
Download and view the complete annual report
Please find page 26 of the 2006 Microsoft annual report below. You can navigate through the pages in the report by either clicking on the pages listed below, or by using the keyword search tool below to find specific information within the annual report.-
 1
1 -
2
-
3
-
4
-
5
-
6
-
7
-
8
-
9
-
10
-
11
-
12
-
13
-
14
-
15
-
 16
16 -
 17
17 -
 18
18 -
 19
19 -
 20
20 -
 21
21 -
 22
22 -
 23
23 -
 24
24 -
 25
25 -
 26
26 -
 27
27 -
 28
28 -
 29
29 -
 30
30 -
 31
31 -
 32
32 -
 33
33 -
 34
34 -
 35
35 -
 36
36 -
37
-
38
-
39
-
40
-
41
-
42
-
43
-
44
-
45
-
46
-
47
-
48
-
49
-
50
-
51
-
52
-
53
-
54
-
55
-
56
-
57
-
58
-
59
-
60
-
61
-
62
-
63
-
64
-
65
-
66
-
67
-
68
-
69
-
70
-
71
-
72
-
73
 |
 |

PAGE 25
and Mid-market Solutions and Partners (“SMS&P”), which focuses on sales to customers and partners in the small and mid-
market customer segments. Revenue is derived from software and services sales, with software sales representing a significant
amount of total revenue. Software revenues include both new software licenses and enhancement plans, which provide
customers with future software upgrades over the period of the plan. Our solutions are delivered through a worldwide network of
channel partners that provide services and local support.
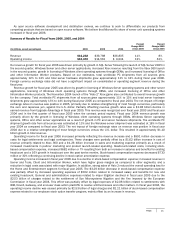
Microsoft Business Solutions revenue increased in fiscal year 2006 driven by new users for Microsoft CRM and existing
Dynamics ERP customers purchasing functionality and user licenses. The increase in Microsoft Business Solutions revenue in
fiscal year 2005 was mainly due to 10% revenue growth in software partially offset by 25% decline in services revenue. The
software revenue increase was driven by 9% growth in license revenue and 16% growth in enhancement revenue and was
attributed to growth in ERP and CRM solutions and an increase in MSPP subscriptions.
Microsoft Business Solutions operating income increased in fiscal year 2006 reflecting the increase in revenue accompanied
by a $56 million decrease in sales and marketing expense as a result of decreased net SMS&P spending. Headcount-related
costs increased 3% reflecting both a 10% increase in headcount and an increase in salaries and benefits for existing
headcount, partially offset by a decrease in stock-based compensation expense. Microsoft Business Solutions operating loss
declined in fiscal year 2005 primarily due to a $175 million decline in stock-based compensation expense, an increase in
product revenue, and a decline in amortization of acquired intangibles. The reduction in operating loss was partially offset by a
net increase in sales and marketing expense driven by incremental costs in the SMS&P organization. In addition, we increased
our marketing and product development spending in our ERP and CRM portfolios.
MSN
(In millions, except percentages) 2006
2005
2004
Percent
Change 2006
versus 2005
Percent
Change 2005
versus 2004
Revenue $2,298
$2,344
$2,270
(2)%
3%
Operating income (loss) $(77
)
$ 412
$98
*
320%
* Not meaningful
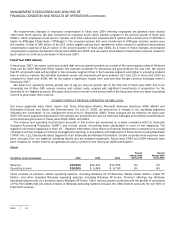
MSN includes personal communications services, such as e-mail and instant messaging, and online information offerings, such
as MSN Search, and the MSN portals and channels around the world. MSN also provides a variety of online paid services in
addition to MSN Internet Access and MSN Premium Web Services. Revenue is derived primarily from advertisers on MSN, from
consumers and partners through subscriptions and transactions generated from online paid services, and from MSN
narrowband Internet access subscribers. In fiscal year 2006, we launched MSN adCenter – our internally developed advertising
platform – in certain international markets and throughout the U.S. where it now serves 100 percent of paid search traffic on
our online properties. We believe MSN adCenter will enable us to increase both display and search advertising revenues by
reducing our reliance on third parties for delivering ads. Effective July 1, 2005, functions related to MapPoint previously
reported in Mobile and Embedded Devices were moved to MSN. Mobile and Embedded Devices and MSN operating results for
the prior periods have been restated for this reorganization. We announced in fiscal year 2006, Windows Live™, a set of
Internet services and software designed to improve the users’ connected experience, including Windows Live™ Local and
Windows Live Messenger.
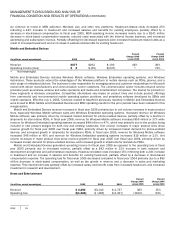
MSN revenue decreased in fiscal year 2006 primarily reflecting a $195 million or 28% decline in access revenue, partially
offset by a $126 million or 9% increase in advertising revenue and a $23 million or 9% increase in revenue from subscription
and transaction services other than access. As of June 30, 2006, MSN had 2.1 million access subscribers compared with
2.7 million at June 30, 2005. In addition, MSN had over 261 million active Hotmail accounts and over 243 million active
Messenger accounts as of June 30, 2006. The increase in advertising revenue reflects growth in display advertising for portals,
channels, email, and messaging services, which was partially offset by a decline in search revenue due to the transition to
adCenter. In fiscal year 2005, MSN revenue increased reflecting $193 million or 16% growth in advertising revenue primarily as
a result of industry and market growth and continued growth of MSN display advertising revenue and $84 million or 88% growth
in subscription and transaction services revenue. These increases were partially offset by the search clarity in advertising
program, the impact of the homepage redesign, and a decline of $219 million or 24% in access revenue, driven by the
continued migration of Internet Access subscribers to broadband or other competitively priced Internet service providers.
MSN operating income decreased in fiscal year 2006 due to a $230 million or 39% increase in research and development
costs, a $126 million or 22% increase in sales and marketing expenses, and a $67 million or 9% increase in cost of revenue as