Microsoft 2006 Annual Report Download - page 60
Download and view the complete annual report
Please find page 60 of the 2006 Microsoft annual report below. You can navigate through the pages in the report by either clicking on the pages listed below, or by using the keyword search tool below to find specific information within the annual report.-
 1
1 -
2
-
3
-
4
-
5
-
6
-
7
-
8
-
9
-
10
-
11
-
12
-
13
-
14
-
15
-
16
-
17
-
18
-
19
-
20
-
21
-
22
-
23
-
24
-
25
-
26
-
27
-
28
-
29
-
30
-
31
-
32
-
33
-
34
-
35
-
36
-
37
-
38
-
39
-
40
-
41
-
42
-
43
-
44
-
45
-
46
-
47
-
48
-
49
-
 50
50 -
 51
51 -
 52
52 -
 53
53 -
 54
54 -
 55
55 -
 56
56 -
 57
57 -
 58
58 -
 59
59 -
 60
60 -
 61
61 -
 62
62 -
 63
63 -
 64
64 -
 65
65 -
 66
66 -
 67
67 -
 68
68 -
 69
69 -
 70
70 -
71
-
72
-
73
 |
 |

PAGE 59
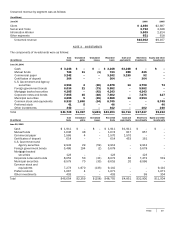
An additional 15% of the total stock and stock awards will be available as additional awards to participants based on individual
performance. One-quarter of the shares of stock subject to each award will vest following the end of the performance period,
and an additional one-quarter of the shares will vest over each of the following three years.
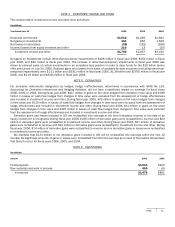
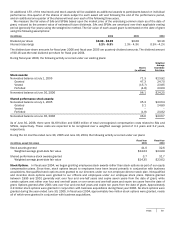
We measure the fair value of SAs and SPSAs based upon the market price of the underlying common stock as of the date of
grant, reduced by the present value of estimated future dividends. SAs and SPSAs are amortized over their applicable vesting
period (generally five years) using the straight-line method. The fair value of each award grant is estimated on the date of grant
using the following assumptions:
(In millions)
2006
2005
2004
Dividend per share
$0.08
-
$0.09
$0.08
$0.16
Interest rates range
3.2%
-
5.3%
1.3% - 4.3%
0.9%
-
4.2%
The dividend per share amounts for fiscal year 2006 and fiscal year 2005 are quarterly dividend amounts. The dividend amount
of $0.16 was the total dividend per share for fiscal year 2004.
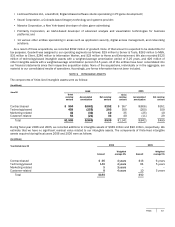
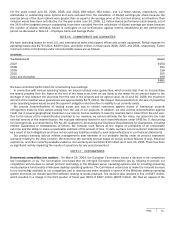
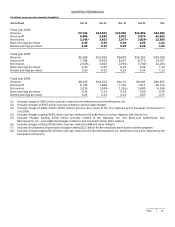
During fiscal year 2006, the following activity occurred under our existing plans:
Shares
(in millions)
Weighted
Average
Grant-Date
Fair Value
Stock awards:
Nonvested balance at Jul
y
1, 2005 71.3
$23.92
Granted 47.3
24.70
Vested (15.7)
23.85
Forfeited (4.8
)
23.60
Nonvested balance at June 30, 2006 98.1
$24.25
Shared performance stock awards:
Nonvested balance at Jul
y
1, 2005 35.3
$23.54
Granted 3.1
24.80
Vested –
–
Forfeited (1.8)
24.92
Nonvested balance at June 30, 2006 36.6
$23.57
As of June 30, 2006, there were $1.69 billion and $383 million of total unrecognized compensation costs related to SAs and
SPSAs, respectively. These costs are expected to be recognized over a weighted average period of 3.1 years and 2.2 years,
respectively.
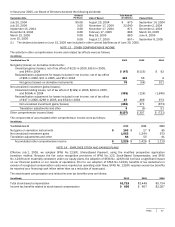
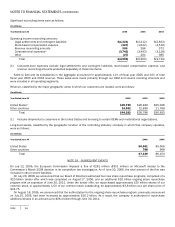
During the 12 months ended June 30, 2005 and June 30, 2004, the following activity occurred under our plans:
(In millions, except fair values)
Fiscal
Y
ear
2005
Fiscal
Y
ear
2004
Stock awards granted 41.0
32.6
Weighted average grant-date fair value $24.03
$24.09
Shared performance stock awards granted 3.7
31.7
Weighted average grant-date fair value $24.35
$23.62
Stock Options. In fiscal year 2004, we began granting employees stock awards rather than stock options as part of our equity
compensation plans. Since then, stock options issued to employees have been issued primarily in conjunction with business
acquisitions. Nonqualified stock options were granted to our directors under our non-employee director stock plan. Nonqualified
and incentive stock options were granted to our officers and employees under our employee stock plans. Options granted
between 1995 and 2001 generally vest over four and one-half years and expire seven years from the date of grant, while
certain options vest either over four and one-half years or over seven and one-half years and expire ten years from the date of
grant. Options granted after 2001 vest over four and one-half years and expire ten years from the date of grant. Approximately
2.9 million stock options were granted in conjunction with business acquisitions during fiscal year 2006. No stock options were
granted during the year ended June 30, 2005. In fiscal year 2004, approximately two million stock options were granted, nearly
all of which were granted in conjunction with business acquisitions.