Microsoft 2006 Annual Report Download - page 61
Download and view the complete annual report
Please find page 61 of the 2006 Microsoft annual report below. You can navigate through the pages in the report by either clicking on the pages listed below, or by using the keyword search tool below to find specific information within the annual report.-
 1
1 -
2
-
3
-
4
-
5
-
6
-
7
-
8
-
9
-
10
-
11
-
12
-
13
-
14
-
15
-
16
-
17
-
18
-
19
-
20
-
21
-
22
-
23
-
24
-
25
-
26
-
27
-
28
-
29
-
30
-
31
-
32
-
33
-
34
-
35
-
36
-
37
-
38
-
39
-
40
-
41
-
42
-
43
-
44
-
45
-
46
-
47
-
48
-
49
-
50
-
 51
51 -
 52
52 -
 53
53 -
 54
54 -
 55
55 -
 56
56 -
 57
57 -
 58
58 -
 59
59 -
 60
60 -
 61
61 -
 62
62 -
 63
63 -
 64
64 -
 65
65 -
 66
66 -
 67
67 -
 68
68 -
 69
69 -
 70
70 -
 71
71 -
72
-
73
 |
 |

PAGE 60
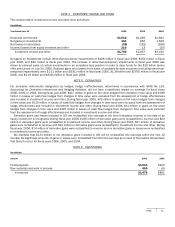
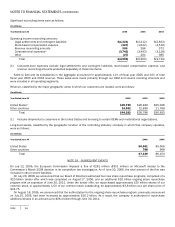
NOTES TO FINANCIAL STATEMENTS (CONTINUED)
During fiscal year 2004, we completed an employee stock option transfer program whereby employees could elect to transfer
all of their vested and unvested options with a strike price of $33.00 or higher to JPMorgan. The options transferred to
JPMorgan were amended and restated upon transfer to contain terms and conditions typical of equity option transactions
entered into between sophisticated financial counterparties at arm’s length using standard terms and definitions for equity
derivatives. As a result of this program, we recorded additional stock-based compensation expense of $2.21 billion ($1.48
billion after-tax or $0.14 per diluted share) which was recorded in the second quarter of fiscal year 2004. As of June 30, 2006,
237 million options transferred to JPMorgan remained outstanding but are excluded from the table below. These options have
strike prices ranging from $28.60 to $89.58 per share and have expiration dates extending through December 2006.
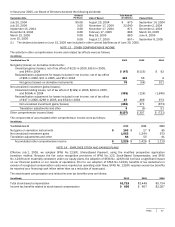
Employee stock options outstanding were as follows:
Shares
(in millions)
Weighted
Average
Exercise Price
Weighted
Average
Remaining
Contractual
Term (years)
Aggregate
Intrinsic
Value
(in millions)
Balance, Jul
y
1, 2005
864
$27.41
Granted
3
23.54
Exercised
(76)
20.59
Canceled
(33)
32.13
Forfeited
(8)
23.01
Balance, June 30, 2006
750
$27.92 4.16
$452
Exercisable, June 30, 2006
673
$28.55 3.93
$343
Included in the options outstanding balance are approximately five million options that were granted in conjunction with
business acquisitions. While these options are included in the options outstanding balance, they are excluded from the
weighted average exercise prices presented. These options have an exercise price range of $0 to $150.93 and a weighted
average exercise price of $11.26.
As of June 30, 2006, there were $402 million of total unrecognized compensation costs related to stock options. These costs
are expected to be recognized over a weighted average period of approximately one year.
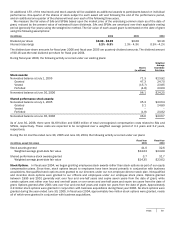
During fiscal years 2006, 2005, and 2004 the following activity occurred under our plans:
(In millions)
2006
2005
2004
Total intrinsic value of stock options exercised $49
1
$940
$
2,971
Total fair value of stock awards vested 377
198
20
Cash received and income tax benefit from stock option exercises for fiscal year 2006 were $1.71 billion and $183 million,
respectively.
NOTE 15 EARNINGS PER SHARE
Basic earnings per share is computed on the basis of the weighted average number of shares of common stock outstanding
during the period. Diluted earnings per share is computed on the basis of the weighted average number of shares of common
stock plus the effect of dilutive potential common shares outstanding during the period using the treasury stock method.
Dilutive potential common shares include outstanding stock options, stock awards, and shared performance stock awards. The
components of basic and diluted earnings per share are as follows:
(In millions, except earnings per share)
Y
ear Ended June 30
2006
2005
2004
Net income available for common shareholders (A)
$12,599 $12,254
$
8,168
Weighted average outstanding shares of common stock (B)
10,438 10,839
10,803
Dilutive effect of employee stock options and awards
93 67
91
Common stock and common stock equivalents (C)
10,53
1
10,906
10,894
Earnings per share:
Basic (A/B)
$
1.2
1
$ 1.13
$
0.76
Diluted (A/C)
$
1.20 $ 1.12
$
0.75