Microsoft 2006 Annual Report Download - page 50
Download and view the complete annual report
Please find page 50 of the 2006 Microsoft annual report below. You can navigate through the pages in the report by either clicking on the pages listed below, or by using the keyword search tool below to find specific information within the annual report.-
 1
1 -
2
-
3
-
4
-
5
-
6
-
7
-
8
-
9
-
10
-
11
-
12
-
13
-
14
-
15
-
16
-
17
-
18
-
19
-
20
-
21
-
22
-
23
-
24
-
25
-
26
-
27
-
28
-
29
-
30
-
31
-
32
-
33
-
34
-
35
-
36
-
37
-
38
-
39
-
 40
40 -
 41
41 -
 42
42 -
 43
43 -
 44
44 -
 45
45 -
 46
46 -
 47
47 -
 48
48 -
 49
49 -
 50
50 -
 51
51 -
 52
52 -
 53
53 -
 54
54 -
 55
55 -
 56
56 -
 57
57 -
 58
58 -
 59
59 -
 60
60 -
61
-
62
-
63
-
64
-
65
-
66
-
67
-
68
-
69
-
70
-
71
-
72
-
73
 |
 |

PAGE 49
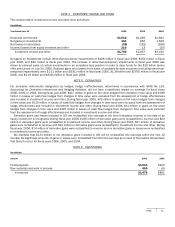
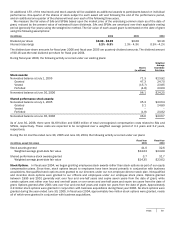
Unearned revenue by segment was as follows:
(In millions)
June 30
2006
2005
Clien
t
$ 2,850
$2,687
Server and Tools 3,792
3,048
Information Worker 3,609
2,814
Other segments 65
1
618
Unearned revenue $10,902
$9,167
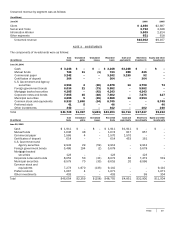
NOTE 3 INVESTMENTS
The components of investments were as follows:
(In millions)
Cost
basis
Unrealized
gains
Unrealized
losses
Recorded
basis
Cash and
equivalents
Short-term
investments
Equity
and
other
investments
June 30, 2006
Cash $ 3,248
$–
$–
$ 3,248
$3,248 $–
$
–
Mutual funds 723
1
1
(1)
733
288 445
–
Commercial paper 3,242
–
–
3,242
3,150 92
–
Certificates of deposit 364
–
–
364
– 364
–
U.S. Government and Agency
securities 4,904
4
(30)
4,878
14 4,790
74
Foreign government bonds 6,034
2
1
(73)
5,982
– 5,982
–
Mortgage backed securities 4,285
–
(42)
4,243
– 4,243
–
Corporate notes and bonds 7,605
15
(18)
7,602
– 7,475
127
Municipal securities 4,008
5
(45)
3,968
14 3,954
–
Common stock and equivalents
6,933
1,846
(34)
8,745
– –
8,745
Preferred stock 4
1
5
–
46
– –
46
Other investments 342
–
–
342
– 102
240
Total $41,729
$1,907
$(243)
$43,393
$6,714 $27,447
$9,232
(In millions)
Cost
basis
Unrealized
gains
Unrealized
losses
Recorded
basis
Cash and
equivalents
Short-term
investments
Equity
and
other
investments
June 30, 2005
Cash $ 1,911
$–
$
–
$ 1,911
$1,911 $–
$–
Mutual funds 1,636
38
–
1,674
817 857
–
Commercial paper 1,566
4
–
1,570
1,570 –
–
Certificates of deposit 614
–
–
614
453 161
–
U.S. Government and
Agency securities 9,943
29
(59)
9,913
– 9,913
–
Foreign government bonds 5,486
194
(2)
5,678
– 5,678
–
Mortgage backed
securities 123
–
–
123
– 123
–
Corporate notes and bonds
8,053
50
(31)
8,072
80 7,473
519
Municipal securities 8,579
70
(33)
8,616
20 8,596
–
Common stock and
equivalents 7,273
1,970
(133)
9,110
– –
9,110
Preferred stock 1,067
4
–
1,071
– –
1,071
Other investments 403
–
–
403
– 99
304
Total $46,654
$2,359
$
(258)
$48,755
$4,851 $32,900
$11,004