Microsoft 2006 Annual Report Download - page 27
Download and view the complete annual report
Please find page 27 of the 2006 Microsoft annual report below. You can navigate through the pages in the report by either clicking on the pages listed below, or by using the keyword search tool below to find specific information within the annual report.-
 1
1 -
2
-
3
-
4
-
5
-
6
-
7
-
8
-
9
-
10
-
11
-
12
-
13
-
14
-
15
-
16
-
 17
17 -
 18
18 -
 19
19 -
 20
20 -
 21
21 -
 22
22 -
 23
23 -
 24
24 -
 25
25 -
 26
26 -
 27
27 -
 28
28 -
 29
29 -
 30
30 -
 31
31 -
 32
32 -
 33
33 -
 34
34 -
 35
35 -
 36
36 -
 37
37 -
38
-
39
-
40
-
41
-
42
-
43
-
44
-
45
-
46
-
47
-
48
-
49
-
50
-
51
-
52
-
53
-
54
-
55
-
56
-
57
-
58
-
59
-
60
-
61
-
62
-
63
-
64
-
65
-
66
-
67
-
68
-
69
-
70
-
71
-
72
-
73
 |
 |

PAGE 26
MANAGEMENT’S DISCUSSION AND ANALYSIS OF
FINANCIAL CONDITION AND RESULTS OF OPERATIONS (CONTINUED)
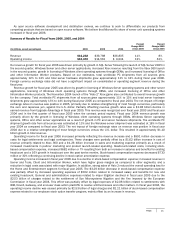
we continue to invest in MSN adCenter, Windows Live, and other new platforms. Headcount-related costs increased 25%
reflecting a 44% increase in headcount and increased salaries and benefits for existing employees, partially offset by a
decrease in stock-based compensation. In fiscal year 2005, MSN operating income increased mainly due to a $241 million
decrease in stock-based compensation expense, reduced costs associated with the Internet Access business, and increased
advertising and subscription revenue. Partially offsetting the decreased expenses were increased headcount-related costs as a
result of increased headcount and an increase in salaries and benefits for existing headcount.
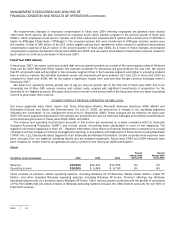
Mobile and Embedded Devices
(In millions, except percentages) 2006
2005
2004
Percent
Change 2006
versus 2005
Percent
Change 2005
versus 2004
Revenue $377
$262
$ 193
44% 36%
Operating income (loss) $2
$(65
)
$(237)
* 73%
* Not meaningful
Mobile and Embedded Devices includes Windows Mobile software, Windows Embedded operating systems, and Windows
Automotive. These products extend the advantages of the Windows platform to mobile devices such as PDAs, phones, and a
wide range of embedded devices. The business is also responsible for managing sales and customer relationships for Microsoft
overall with device manufacturers and communication sector customers. The communication sector includes network service
providers (such as wireless, wireline and cable operators) and media and entertainment companies. The market for products in
these segments is intensely competitive. Competitive alternatives vary based on product lines and include product offerings
from commercial and non-commercial mobile operating system providers, and proprietary software developed by OEMs and
mobile operators. Effective July 1, 2005, functions related to MapPoint previously reported in Mobile and Embedded Devices
were moved to MSN. Mobile and Embedded Devices and MSN operating results for the prior periods have been restated for this
reorganization.
Mobile and Embedded Devices revenue increased in fiscal year 2006 primarily due to unit volume increases in major product
lines, especially Windows Mobile software sales and Windows Embedded operating systems. Increased revenue for Windows
Mobile software was primarily driven by increased market demand for phone-enabled devices, partially offset by a decline in
shipments for stand-alone PDAs. In fiscal year 2006, revenue for Windows Mobile software increased $55 million or 37% while
revenue for Windows Embedded operating systems increased $49 million or 47%, which was primarily due to the product being
included in new product designs for both new and existing customers. Unit volume increases in major product lines drove
revenue growth for fiscal year 2005 over fiscal year 2004, primarily driven by increased market demand for phone-enabled
devices, and increased growth in shipments for standalone PDAs. In fiscal year 2005, revenue for Windows Mobile software
increased $46 million or 45% and revenue for Windows Embedded operating systems increased $19 million or 21%. Unit
volume increases in major product lines drove revenue growth for fiscal year 2005 over fiscal year 2004, primarily driven by
increased market demand for phone-enabled devices, and increased growth in shipments for standalone PDAs.
Mobile and Embedded Devices generated operating income for fiscal year 2006 as opposed to the operating loss in fiscal
year 2005 primarily due to increased revenue, partially offset by a $42 million or 21% increase in both research and
development and general and administrative expenses. Headcount-related costs increased 15% reflecting both a 24% increase
in headcount and an increase in salaries and benefits for existing headcount, partially offset by a decrease in stock-based
compensation expense. The operating loss for fiscal year 2005 decreased compared to fiscal year 2004 primarily due to a $95
million decrease in stock-based compensation, as well as the growth in revenue and a decrease in sales and marketing
expense. This improvement was partially offset by increased salary and benefit costs from increased headcount, and increased
investment in research and development.
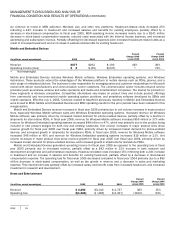
Home and Entertainment
(In millions, except percentages) 2006
2005
2004
Percent
Change 2006
versus 2005
Percent
Change 2005
versus 2004
Revenue $
4,256
$
3,140
$
2,737
36%
15%
Operating loss $
(1,262)
$
(485)
$
(1,337)
(160)%
64%