Microsoft 2006 Annual Report Download - page 32
Download and view the complete annual report
Please find page 32 of the 2006 Microsoft annual report below. You can navigate through the pages in the report by either clicking on the pages listed below, or by using the keyword search tool below to find specific information within the annual report.-
 1
1 -
2
-
3
-
4
-
5
-
6
-
7
-
8
-
9
-
10
-
11
-
12
-
13
-
14
-
15
-
16
-
17
-
18
-
19
-
20
-
21
-
 22
22 -
 23
23 -
 24
24 -
 25
25 -
 26
26 -
 27
27 -
 28
28 -
 29
29 -
 30
30 -
 31
31 -
 32
32 -
 33
33 -
 34
34 -
 35
35 -
 36
36 -
 37
37 -
 38
38 -
 39
39 -
 40
40 -
 41
41 -
 42
42 -
43
-
44
-
45
-
46
-
47
-
48
-
49
-
50
-
51
-
52
-
53
-
54
-
55
-
56
-
57
-
58
-
59
-
60
-
61
-
62
-
63
-
64
-
65
-
66
-
67
-
68
-
69
-
70
-
71
-
72
-
73
 |
 |

PAGE 31
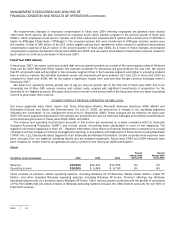
For fiscal year 2005, sales and marketing expense increased slightly due to $470 million higher headcount-related costs
from increased headcount and general salary increases; higher sales and marketing costs driven by product planning, reseller
marketing, and advertising campaign costs mainly related to launch of the “Start Something” campaign; launch of “Halo 2”; and
launch arrangements for Xbox 360. The increase was offset mainly by a $660 million decrease in stock-based compensation
expense.
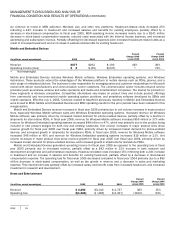
General and Administrative
(In millions, except percentages) 2006
2005
2004
Percent
Change 2006
versus 2005
Percent
Change 2005
versus 2004
General and administrative $3,758
$4,536
$5,275
(17)%
(14)%
As a percent of revenue
8%
11%
14
%
(3)ppt
(3)ppt
General and administrative costs include payroll, employee benefits, stock-based compensation expense and other headcount-
related costs associated with finance, legal, facilities, certain human resources, other administrative headcount, and legal and
other administrative fees. General and administrative costs decreased in fiscal year 2006 primarily reflecting decreased costs
for legal settlements and legal contingencies. We incurred $1.32 billion in legal charges during fiscal year 2006 as compared to
$2.31 billion in legal charges incurred during fiscal year 2005. Headcount-related costs increased 7% during the twelve months
ended June 30, 2006 reflecting both an 18% increase in headcount and an increase in salaries and benefits for existing
headcount, partially offset by a decrease in stock-based compensation expense. General and administrative costs decreased in
fiscal year 2005 primarily reflecting decreased stock-based compensation expense and decreased costs for legal settlements
and legal contingencies. In fiscal year 2005, we recognized $277 million of stock-based compensation expense as compared to
$664 million in fiscal year 2004. In fiscal year 2005, we recognized $2.31 billion in legal charges as compared to $2.83 billion
in fiscal year 2004.
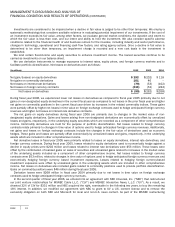
Investment Income and Other
The components of investment income and other were as follows:
(In millions)
2006
2005
2004
Dividends and interest
$
1,510
$1,460
$1,892
Net gains on investments
16
1
856
1,563
Net losses on derivatives
(99) (262
)
(268)
Income/(losses) from equity investees and other
218
13
(25)
Investment income and other
$
1,790
$2,067
$3,162
For fiscal year 2006, dividends and interest income increased due to higher interest rates received on our fixed-income
investments, partially offset by a decline in the average balance of dividend and interest-bearing investments as a result of the
$32.64 billion special dividend paid on December 2, 2004, and stock repurchases made throughout fiscal year 2006.
Dividends and interest income declined $432 million in fiscal year 2005 due to the combination of a greater allocation of funds
to lower yielding, more liquid asset classes in preparation for the $32.64 billion special dividend paid on December 2, 2004,
and a lower portfolio balance following payment of the special dividend.
For fiscal year 2006, net recognized gains on investments were comprised of net gains on sales of equity investments, net
losses on sales of fixed-income investments and other-than-temporary impairments on both equity and fixed-income
investments. Net recognized gains decreased in fiscal year 2006 primarily due to increased net losses on sales of fixed-income
investments, higher other-than-temporary impairments and fewer net gains on equity investments in the current period as
compared to fiscal year 2005. For fiscal year 2006, other-than-temporary impairments were $408 million, as compared to $152
million in fiscal year 2005. The increase in other-than-temporary impairments in fiscal year 2006 was driven by planned sales of
certain investments in an unrealized loss position in order to raise funds for the $20 billion tender offer announced on July 20,
2006. Net gains on investments declined $707 million in fiscal year 2005 primarily due to greater sales of investments in the
previous fiscal year in preparation for the special dividend paid on December 2, 2004. Net gains on investments also include
other-than-temporary impairments of $152 million in fiscal year 2005 compared to $82 million in fiscal year 2004. Net realized
gains on sales were $1.65 billion in fiscal year 2004 as we moved to more liquid investment asset classes.