Microsoft 2006 Annual Report Download - page 28
Download and view the complete annual report
Please find page 28 of the 2006 Microsoft annual report below. You can navigate through the pages in the report by either clicking on the pages listed below, or by using the keyword search tool below to find specific information within the annual report.-
 1
1 -
2
-
3
-
4
-
5
-
6
-
7
-
8
-
9
-
10
-
11
-
12
-
13
-
14
-
15
-
16
-
17
-
 18
18 -
 19
19 -
 20
20 -
 21
21 -
 22
22 -
 23
23 -
 24
24 -
 25
25 -
 26
26 -
 27
27 -
 28
28 -
 29
29 -
 30
30 -
 31
31 -
 32
32 -
 33
33 -
 34
34 -
 35
35 -
 36
36 -
 37
37 -
 38
38 -
39
-
40
-
41
-
42
-
43
-
44
-
45
-
46
-
47
-
48
-
49
-
50
-
51
-
52
-
53
-
54
-
55
-
56
-
57
-
58
-
59
-
60
-
61
-
62
-
63
-
64
-
65
-
66
-
67
-
68
-
69
-
70
-
71
-
72
-
73
 |
 |

PAGE 27
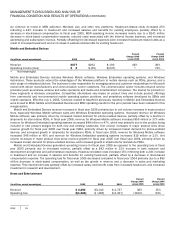
Home and Entertainment includes the Microsoft Xbox video game console system, PC games, CPxG (consumer software and
hardware products), and TV platform products for the interactive television industry. The success of video game consoles is
determined by console innovation, the portfolio of video game content for the console, online offerings, and the market share of
the console. Our Xbox business is transitioning to a new console, the Xbox 360, which launched in the second quarter of fiscal
year 2006. We believe that the functionality of our new console, games portfolio, and online offerings are well-positioned
relative to forthcoming competitive consoles. We also believe launching in advance of competitive consoles will provide a
strategic advantage for the long-term success of Xbox 360. Revenue from the first generation of Xbox products has declined
and is expected to continue to decline as a result of the introduction of Xbox 360.
Home and Entertainment revenue increased in fiscal year 2006 primarily due to the launch of the Xbox 360 console partially
offset by a decline in first party Xbox game sales primarily resulting from the significant impact of Halo 2 in fiscal year 2005. We
sold approximately 5 million Xbox 360 consoles during fiscal year 2006. The revenue growth was also attributable to $140
million or 15% growth from our other product lines, primarily as a result of an increase in PC games sales due to significant new
game releases, especially “Age of Empires III”, and an increase in MSTV revenue due to deployments in fiscal year 2006.
Revenue increased in fiscal year 2005 primarily due to significant new product launches, which resulted in a $416 million or
23% increase in Xbox revenue. Halo 2 was introduced in the second quarter of fiscal year 2005 and generated over $300
million in revenue in fiscal year 2005. Revenue from consumer hardware and software, PC games, and TV platforms declined
$50 million or 5% compared to fiscal year 2004 due to lower PC games software sales.
Home and Entertainment operating loss increased in fiscal year 2006 primarily as a result of a $1.64 billion increase in cost
of revenue resulting from the number of Xbox 360 consoles sold and higher Xbox 360 unit costs, partially offset by the revenue
growth. Our fiscal year 2006 operating loss increased due to the significant impact of Halo 2 in fiscal year 2005. Headcount-
related costs increased 5% reflecting both a 19% increase in headcount and an increase in salaries and benefits for existing
headcount, partially offset by a decrease in stock-based compensation expense. The fiscal year 2005 operating loss decreased
primarily due to an increase in high margin Xbox software sales, lower Xbox console units costs, a $90 million lower-of-cost-or-
market inventory adjustment recorded in fiscal year 2004, and a $219 million decrease in stock-based compensation expense.
The decrease was partially offset by an increase in costs associated with Xbox 360 console development and related launch
efforts.
Corporate-Level Activity
(In millions, except percentages) 2006
2005
2004
Percent
Change 2006
versus 2005
Percent
Change 2005
versus 2004
Corporate-level expenses $5,026
$5,910
$6,871
(15)%
(14)%
Certain corporate-level expenses are not allocated to our segments. Those expenses primarily include corporate operations
related to broad-based sales and marketing, product support services, human resources, legal, finance, information technology,
corporate development and procurement activities, research and development and other costs, and legal settlements and
contingencies.
Corporate-level expenses decreased in fiscal year 2006, primarily reflecting a $991 million decrease in costs for legal
settlements and legal contingencies partially offset by an $84 million increase in headcount-related costs. We incurred $1.32
billion in legal charges during fiscal year 2006 including settlement expense of $361 million related to our settlement with
RealNetworks, Inc. as well as other intellectual property and antitrust matters, and the €281 million ($351 million) fine imposed
by the European Commission in July 2006 related to its 2004 decision in its competition law investigation of Microsoft, as
compared to $2.31 billion in legal charges incurred during the prior year primarily related to settlements with Novell, Inc.,
Gateway, IBM, and other antitrust and competition law matters. Headcount-related costs increased 5% during the twelve
months ended June 30, 2006 reflecting both a 23% increase in headcount and an increase in salaries and benefits for existing
headcount, partially offset by a decrease in stock-based compensation.
Corporate-level expenses decreased in fiscal year 2005, primarily as a result of a $736 million reduction in stock-based
compensation expense and decreased costs for legal settlements and legal contingencies. In fiscal year 2005, we recognized
$2.31 billion in legal charges as compared to $2.53 billion in fiscal year 2004 which included a $1.92 billion charge for a
settlement with the Sun Microsystems, Inc., and the fine of €497 million ($605 million) imposed by the European Commission.