Microsoft 2006 Annual Report Download - page 45
Download and view the complete annual report
Please find page 45 of the 2006 Microsoft annual report below. You can navigate through the pages in the report by either clicking on the pages listed below, or by using the keyword search tool below to find specific information within the annual report.-
 1
1 -
2
-
3
-
4
-
5
-
6
-
7
-
8
-
9
-
10
-
11
-
12
-
13
-
14
-
15
-
16
-
17
-
18
-
19
-
20
-
21
-
22
-
23
-
24
-
25
-
26
-
27
-
28
-
29
-
30
-
31
-
32
-
33
-
34
-
 35
35 -
 36
36 -
 37
37 -
 38
38 -
 39
39 -
 40
40 -
 41
41 -
 42
42 -
 43
43 -
 44
44 -
 45
45 -
 46
46 -
 47
47 -
 48
48 -
 49
49 -
 50
50 -
 51
51 -
 52
52 -
 53
53 -
 54
54 -
 55
55 -
56
-
57
-
58
-
59
-
60
-
61
-
62
-
63
-
64
-
65
-
66
-
67
-
68
-
69
-
70
-
71
-
72
-
73
 |
 |

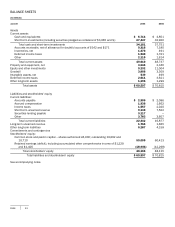
PAGE 44
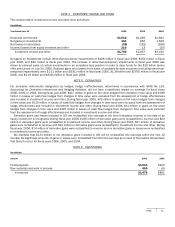
STOCKHOLDERS’ EQUITY STATEMENTS
(In millions)
Y
ear Ended June 30
2006
2005
2004
Common stock and paid-in capital
Balance, beginning of period
$
60,413
$ 56,396
$49,234
Common stock issued
1,939
3,223
2,815
Common stock repurchased
(4,447) (1,737)
(416)
Stock-based compensation expense
1,715
2,448
5,734
Stock option income tax benefits/(deficiencies)
(617) 89
(989)
Other, net
2
(6)
18
Balance, end of period
59,005
60,413
56,396
Retained earnin
g
s (deficit)
Balance, beginning of period
(12,298) 18,429
15,678
Net income
12,599
12,254
8,168
Other comprehensive income:
Net gains/(losses) on derivative instruments
76
(58)
101
Net unrealized investments gains/(losses)
(282) 371
(873)
Translation adjustments and other
9
(6)
51
Comprehensive income
12,402
12,561
7,447
Common stock cash dividends
(3,594) (36,968)
(1,729)
Common stock repurchased
(15,41
1
) (6,320)
(2,967)
Balance, end of period
(18,90
1
) (12,298)
18,429
Total stockholders’ equit
y
$
40,104
$ 48,115
$74,825
See accompanying notes.