Microsoft 2006 Annual Report Download - page 25
Download and view the complete annual report
Please find page 25 of the 2006 Microsoft annual report below. You can navigate through the pages in the report by either clicking on the pages listed below, or by using the keyword search tool below to find specific information within the annual report.-
 1
1 -
2
-
3
-
4
-
5
-
6
-
7
-
8
-
9
-
10
-
11
-
12
-
13
-
14
-
 15
15 -
 16
16 -
 17
17 -
 18
18 -
 19
19 -
 20
20 -
 21
21 -
 22
22 -
 23
23 -
 24
24 -
 25
25 -
 26
26 -
 27
27 -
 28
28 -
 29
29 -
 30
30 -
 31
31 -
 32
32 -
 33
33 -
 34
34 -
 35
35 -
36
-
37
-
38
-
39
-
40
-
41
-
42
-
43
-
44
-
45
-
46
-
47
-
48
-
49
-
50
-
51
-
52
-
53
-
54
-
55
-
56
-
57
-
58
-
59
-
60
-
61
-
62
-
63
-
64
-
65
-
66
-
67
-
68
-
69
-
70
-
71
-
72
-
73
 |
 |

PAGE 24
MANAGEMENT’S DISCUSSION AND ANALYSIS OF
FINANCIAL CONDITION AND RESULTS OF OPERATIONS (CONTINUED)
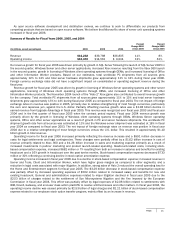
Server application revenue, including CAL revenue, grew $1.10 billion or 17%. Consulting, Premier, and Professional product
support services revenue increased $241 million or 19% compared to the previous year. Foreign currency exchange rate
changes accounted for $284 million or three percentage points of total Server and Tools revenue growth, which was offset by a
$314 million decline in Upgrade Advantage revenue earned.
Server and Tools operating income increased during fiscal year 2006 primarily reflecting increased revenue, partially offset
by increased sales and marketing expenses. Excluding headcount-related costs, sales and marketing expenses increased $274
million due to additional spending to support long-term strategies and marketing expenses primarily related to the launch of
SQL Server 2005 and Visual Studio 2005. Total Server and Tools headcount-related costs increased 5% related to both an 11%
increase in headcount and an increase in salaries and benefits for existing headcount, partially offset by a decrease in stock-
based compensation expense. In fiscal year 2005, Server and Tools operating income increased primarily due to increased
revenue and a $1.07 billion decrease in stock-based compensation expense. This increase was partially offset by an increase in
sales and marketing costs and headcount-related costs as a result of increased headcount and an increase in salaries and
benefits for existing headcount.
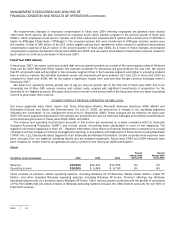
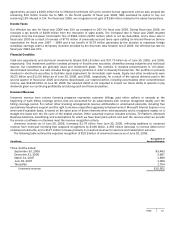
Information Worker
(In millions, except percentages) 2006
2005
2004
Percent
Change 2006
versus 2005
Percent
Change 2005
versus 2004
Revenue $
11,756
$11,169
$10,748
5%
4%
Operating income $
8,285
$ 8,025
$ 7,458
3%
8%
Information Worker primarily consists of the Microsoft Office system of programs, servers, solutions, and services designed to
increase personal, team, and organization productivity. Information Worker includes Microsoft Office, Microsoft Project,
Microsoft Visio, SharePoint Portal Server CAL, and other information worker products including Office Communications Server
and OneNote. Revenue growth depends on the ability to add value to the core Office product set and expand our product
offerings in other information worker areas such as enterprise content management, collaboration, unified communications,
and business intelligence.
Information Worker revenue increased in fiscal year 2006 primarily reflecting a $521 million or 5% increase in volume
licensing, retail packaged products, and preinstalled versions of Office in Japan, while OEM revenue increased $66 million or
4%. Information Worker revenue increased in fiscal year 2005 primarily reflecting a $269 million or 3% increase in volume
licensing, retail packaged product, and pre-installed versions of Office in Japan, a $91 million or 6% increase in OEM revenue,
and the impact of foreign currency exchange rates, partially offset by reduced Upgrade Advantage earned revenue. Changes in
foreign currency exchange rates accounted for approximately $367 million or three percentage points of the revenue growth for
fiscal year 2005, offset by a $663 million decline in Upgrade Advantage earned revenue.
Information Worker operating income increased in fiscal year 2006 primarily due to the revenue growth, partially offset by a
$283 million or 15% increase in sales and marketing expenses related to supporting field sales efforts and a $71 million or
10% increase in research and development expenses. Headcount-related costs increased 14% during fiscal year 2006
reflecting both an 18% increase in headcount related to supporting field sales efforts and research and development
investments in future products and an increase in salaries and benefits for existing headcount, partially offset by a decrease in
stock-based compensation expense. Information Worker operating income growth for fiscal year 2005 was primarily due to the
revenue growth and a $304 million decrease in stock-based compensation expense. Operating expenses were also impacted by
a reduction in marketing campaign costs from the previous period associated with the launch of Office 2003. This decline was
offset by an increase in headcount-related costs as a result of an increase in headcount and an increase in salaries and
benefits for existing headcount.
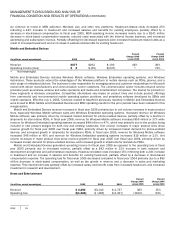
Microsoft Business Solutions
(In millions, except percentages) 2006
2005
2004
Percent
Change 2006
versus 2005
Percent
Change 2005
versus 2004
Revenue $
919
$
784
$ 742
17%
6%
Operatin
g
income (loss) $
24
$
(171)
$(291)
*
41%
* Not meaningful
Microsoft Business Solutions provides business management software solutions targeted to businesses of varying sizes. The
main products consist of enterprise resource planning (“ERP”) solutions, customer relationship management (“CRM”) software,
retail solutions, Microsoft Partner Program (“MSPP”), and related services. Microsoft Business Solutions also includes the Small