Microsoft 2006 Annual Report Download - page 24
Download and view the complete annual report
Please find page 24 of the 2006 Microsoft annual report below. You can navigate through the pages in the report by either clicking on the pages listed below, or by using the keyword search tool below to find specific information within the annual report.-
 1
1 -
2
-
3
-
4
-
5
-
6
-
7
-
8
-
9
-
10
-
11
-
12
-
13
-
 14
14 -
 15
15 -
 16
16 -
 17
17 -
 18
18 -
 19
19 -
 20
20 -
 21
21 -
 22
22 -
 23
23 -
 24
24 -
 25
25 -
 26
26 -
 27
27 -
 28
28 -
 29
29 -
 30
30 -
 31
31 -
 32
32 -
 33
33 -
 34
34 -
35
-
36
-
37
-
38
-
39
-
40
-
41
-
42
-
43
-
44
-
45
-
46
-
47
-
48
-
49
-
50
-
51
-
52
-
53
-
54
-
55
-
56
-
57
-
58
-
59
-
60
-
61
-
62
-
63
-
64
-
65
-
66
-
67
-
68
-
69
-
70
-
71
-
72
-
73
 |
 |

PAGE 23
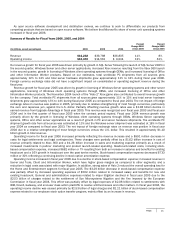
Client revenue increased in fiscal year 2006 reflecting $1.18 billion or 12% growth in OEM revenue driven by 17% growth in
OEM license units from increased PC unit shipments, partially offset by a $118 million or 6% decrease in revenue from
commercial and retail licensing of Windows operating systems. During the year, the mix of OEM Windows operating systems
licensed with premium edition operating systems as a percentage of total OEM Windows operating systems licensed (“OEM
Premium Mix”) increased two percentage points to 52%. OEM revenue growth included an increase to revenue of $89 million
resulting from the alignment of our billings associated with OEM distributors in our system builder channel with both industry
standards and other Microsoft channels. The differences between unit growth rates and revenue growth rates from year to year
are affected by changes in the OEM Premium Mix, changes in the geographical mix, and the channel mix of products sold by
large, multi-national OEMs versus those sold by local and regional system builders. Client revenue increased in fiscal year 2005
driven by 12% growth in OEM license units and $886 million or 10% growth in OEM revenue from increased PC unit shipments,
partially offset by a $198 million or 9% decrease in revenue from commercial and retail licensing of Windows operating
systems. The OEM Premium Mix remained flat at 50% of total OEM Windows operating systems as compared to the previous
year. Revenue earned from Upgrade Advantage declined by $99 million in fiscal year 2005 contributing to the decrease in
commercial and retail licensing revenue.
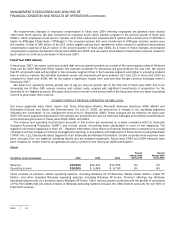
Client operating income increased in fiscal year 2006 reflecting the increase in OEM revenue partially offset by a $224
million increase in sales and marketing expenses, excluding headcount-related costs, mainly driven by increased investments in
partner marketing and Windows Vista pre-launch programs. Headcount-related costs increased 6% in fiscal year 2006 reflecting
both a 13% increase in headcount primarily associated with Windows Vista and further investments in our sales and marketing
organization, and an increase in salaries and benefits for existing headcount, partially offset by a decrease in stock-based
compensation expense. Client operating income increased in fiscal year 2005 primarily due to an increase in OEM revenue and
a $444 million decrease in stock-based compensation expense. These factors were partially offset by an increase in sales and
marketing expenses associated with “Start Something,” a globally launched advertising campaign, marketing for security
initiatives, and an increase in salary and benefits for new and existing headcount. The additional headcount for research and
development was primarily devoted to the continued development of Windows Vista.
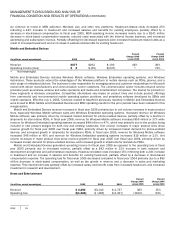
Server and Tools
(In millions, except percentages) 2006
2005
2004
Percent
Change 2006
versus 2005
Percent
Change 2005
versus 2004
Revenue $
11,467
$
9,938
$
8,590
15%
16%
Operating income $
4,323
$
3,291
$
1,474
31%
123%
Server and Tools consists of server software licenses and client access licenses (“CAL”) for Windows Server, Microsoft SQL
Server, Exchange Server and other server products. It also includes developer tools, training, certification, Microsoft Press,
Premier and Professional product support services, and Microsoft Consulting Services. Server and Tools concentrates on
licensing products, applications, tools, content and services that make information technology professionals and developers
more productive and efficient. The segment uses multiple channels for licensing including pre-installed OEM versions, licenses
through partners, and licenses directly to end customers. The licenses are sold both as one-time licenses and as multi-year
volume licenses. Server and Tools uses product innovation and partnerships with information technology professionals to drive
the adoption and sales growth of its products.
Server and Tools revenue increased during fiscal year 2006 mainly driven by growth in SQL Server, Windows Server, and
Core CAL. SQL Server 2005 and Visual Studio 2005 were launched in the second quarter of fiscal year 2006 and produced
revenue growth in these product lines. Revenue is impacted by overall server hardware shipments which we estimate grew 11%
to 13% in fiscal year 2006. Server and Server applications revenue, including CAL revenue, and developer tools, training and
certification revenue grew $1.31 billion or 16% during fiscal year 2006. The results reflect broad adoption of Windows Server
products, especially SQL Server, which grew over 30% for the year. Consulting, Premier and Professional product support
services revenue increased $218 million or 15% primarily due to higher demand for services. In fiscal year 2005, Server and