Microsoft 2006 Annual Report Download - page 23
Download and view the complete annual report
Please find page 23 of the 2006 Microsoft annual report below. You can navigate through the pages in the report by either clicking on the pages listed below, or by using the keyword search tool below to find specific information within the annual report.-
 1
1 -
2
-
3
-
4
-
5
-
6
-
7
-
8
-
9
-
10
-
11
-
12
-
 13
13 -
 14
14 -
 15
15 -
 16
16 -
 17
17 -
 18
18 -
 19
19 -
 20
20 -
 21
21 -
 22
22 -
 23
23 -
 24
24 -
 25
25 -
 26
26 -
 27
27 -
 28
28 -
 29
29 -
 30
30 -
 31
31 -
 32
32 -
 33
33 -
34
-
35
-
36
-
37
-
38
-
39
-
40
-
41
-
42
-
43
-
44
-
45
-
46
-
47
-
48
-
49
-
50
-
51
-
52
-
53
-
54
-
55
-
56
-
57
-
58
-
59
-
60
-
61
-
62
-
63
-
64
-
65
-
66
-
67
-
68
-
69
-
70
-
71
-
72
-
73
 |
 |

PAGE 22
MANAGEMENT’S DISCUSSION AND ANALYSIS OF
FINANCIAL CONDITION AND RESULTS OF OPERATIONS (CONTINUED)
We implemented changes in employee compensation in fiscal year 2004 whereby employees are granted stock awards
rather than stock options. We also completed an employee stock option transfer program in the second quarter of fiscal year
2004 in which employees could elect to transfer all of their vested and unvested stock options with a strike price of $33.00 or
higher to JPMorgan Chase Bank (“JPMorgan”). The unvested options that were transferred to JPMorgan became vested upon
the transfer. A total of 345 million of the 621 million eligible options were transferred, which resulted in additional stock-based
compensation expense of $2.21 billion in the second quarter of fiscal year 2004. As a result of these changes, stock-based
compensation expense decreased in fiscal years 2006 and 2005, and we expect stock-based compensation expense related to
stock options to continue to decrease in fiscal year 2007.
Fiscal Year 2007 Outlook
In fiscal year 2007, we expect continued double digit revenue growth primarily as a result of the upcoming launches of Windows
Vista and the 2007 Microsoft Office system. We estimate worldwide PC shipments will grow between 8% and 10%. We expect
that PC unit growth rates will be higher in the consumer segment than in the business segment and higher in emerging markets
than in mature markets. We estimate worldwide server unit shipments will grow between 10% and 12% in fiscal year 2007 as
compared to fiscal year 2006. We do not expect a significant impact from year-over-year foreign currency exchange rates in
fiscal year 2007.
We expect our operating income growth rate to lag our revenue growth rate in the first half of fiscal year 2007 due to an
increasing mix of Xbox 360 console revenue and related costs, coupled with significant investments in preparation for the
launches of our flagship products. We expect this trend to reverse in the second half of the fiscal year when we expect operating
income to grow faster than revenue.
SEGMENT PRODUCT REVENUE/OPERATING INCOME (LOSS)
Our seven segments were Client; Server and Tools; Information Worker; Microsoft Business Solutions; MSN; Mobile and
Embedded Devices; and Home and Entertainment. On July 17, 2006, we announced a change in our operating segments
reflecting the culmination of our realignment announced in September 2005. These changes will be effective for fiscal year
2007; the seven segments discussed in this analysis are presented the way we internally managed and monitored performance
at the business group level in fiscal years 2006, 2005, and 2004.
The revenue and operating income/(loss) amounts in this section are presented on a basis consistent with U.S. Generally
Accepted Accounting Principles (“GAAP”) and include certain reconciling items attributable to each of the segments. The
segment information appearing in Note 18 – Segment Information of the Notes to Financial Statements is presented on a basis
consistent with the Company’s internal management reporting, in accordance with Statement of Financial Accounting Standards
(“SFAS”) No. 131, Disclosures about Segments of an Enterprise and Related Information. Certain corporate level expenses have
been excluded from our segment operating results and are analyzed separately. Fiscal years 2005 and 2004 amounts have
been restated for certain internal reorganizations and to conform to the fiscal year 2006 presentation.
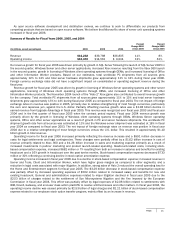
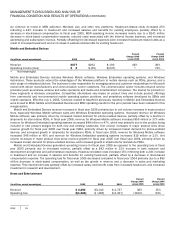
Client
(In millions, except percentages) 2006
2005
2004
Percent
Change 2006
versus 2005
Percent
Change 2005
versus 2004
Revenue $
13,209
$12,151
$
11,556
9%
5%
Operating income $
10,203
$ 9,464
$
8,740
8%
8%
Client consists of premium edition operating systems, including Windows XP Professional, Media Center Edition, Tablet PC
Edition, and other standard Windows operating systems, including Windows XP Home. Premium offerings are Windows
operating systems sold at a premium above Windows XP Home. Client revenue growth correlates with the growth of purchases
of PCs from OEMs that pre-install versions of Windows operating systems because the OEM channel accounts for over 80% of
total Client revenue.