Microsoft 2006 Annual Report Download - page 53
Download and view the complete annual report
Please find page 53 of the 2006 Microsoft annual report below. You can navigate through the pages in the report by either clicking on the pages listed below, or by using the keyword search tool below to find specific information within the annual report.-
 1
1 -
2
-
3
-
4
-
5
-
6
-
7
-
8
-
9
-
10
-
11
-
12
-
13
-
14
-
15
-
16
-
17
-
18
-
19
-
20
-
21
-
22
-
23
-
24
-
25
-
26
-
27
-
28
-
29
-
30
-
31
-
32
-
33
-
34
-
35
-
36
-
37
-
38
-
39
-
40
-
41
-
42
-
 43
43 -
 44
44 -
 45
45 -
 46
46 -
 47
47 -
 48
48 -
 49
49 -
 50
50 -
 51
51 -
 52
52 -
 53
53 -
 54
54 -
 55
55 -
 56
56 -
 57
57 -
 58
58 -
 59
59 -
 60
60 -
 61
61 -
 62
62 -
 63
63 -
64
-
65
-
66
-
67
-
68
-
69
-
70
-
71
-
72
-
73
 |
 |

PAGE 52
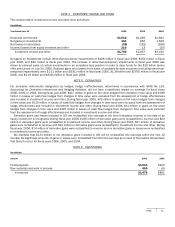
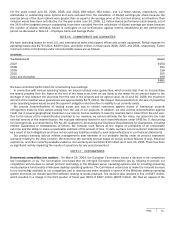
NOTES TO FINANCIAL STATEMENTS (CONTINUED)
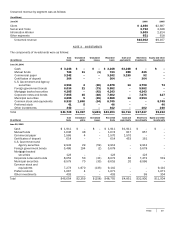
NOTE 7 PROPERTY AND EQUIPMENT
(In millions)
June 30
2006
2005
Land
$ 362
$ 313
Buildings and improvements
2,228
2,014
Leasehold improvements
918
851
Computer equipment and software
2,682
2,318
Furniture and equipment
1,033
879
Property and equipment, at cost
7,223
6,375
Accumulated depreciation
(4,179)
(4,029)
Property and equipment, net
$3,044
$2,346
Property and equipment are stated at cost. Depreciation is computed principally on the straight-line method over the estimated
useful lives of the assets. The useful lives for buildings range from five to 15 years, leasehold improvements range from two to
ten years – representing the applicable lease terms plus reasonably assured extensions, computer equipment and software
range from two to three years, and furniture and equipment range from one to five years. Land is not depreciated.
During fiscal years 2006, 2005, and 2004, depreciation expense was $863 million, $723 million, and $647 million,
respectively. The majority of depreciation expense in all years related to computer equipment.
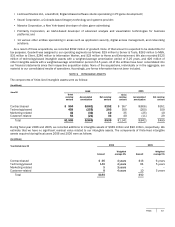
NOTE 8 GOODWILL
Changes in the carrying amount of goodwill for fiscal years 2006 and 2005 by segment were as follows:
(In millions)
Balance as
of June 30,
2004
A
cquisitions
/ purchase
accounting
adjustments
Divestitures
Balance as
of June 30,
2005
Acquisitions
Other
Balance as
of June 30,
2006
Clien
t
$ 37
$
6
$
–
$
43
$ 31 $
–
$
74
Server and Tools 106
135
–
241
29 (14)
256
Information Worker 178
47
–
225
246 –
47
1
Microsoft Business Solutions 2,207
3
–
2,210
– –
2,210
MSN 154
17
–
171
263 21
455
Mobile and Embedded Devices 30
–
–
30
– (24)
6
Home and Entertainment 403
–
(14)
389
23 (18)
393
Total $3,115
$208
$(14)
$3,309
$592 $(35)
$3,866
We test goodwill for impairment annually during the first quarter of each fiscal year at the reporting unit level using a fair value
approach, in accordance with the provisions of SFAS No. 142, Goodwill and Other Intangible Assets. Our annual testing resulted
in no impairments of goodwill in fiscal years 2006 and 2005. If an event occurs or circumstances change that would more likely
than not reduce the fair value of a reporting unit below its carrying value, goodwill will be evaluated for impairment between
annual tests.
During fiscal year 2005, we had no material acquisitions. During the fiscal year 2006, we acquired the following entities for a
total consideration of $689 million, which was primarily paid in cash:
• Frontbridge Technologies, Inc., a California-based provider of managed services that addresses corporate e-mail
compliance, security, and availability requirements;
• Teleo, Inc., a California-based voice over Internet protocol software and services provider;
• MediaStreams.com AG, a Zurich, Switzerland-based developer of PC-based voice over Internet protocol communication
systems and peripheral equipment;