Microsoft 2012 Annual Report Download - page 20
Download and view the complete annual report
Please find page 20 of the 2012 Microsoft annual report below. You can navigate through the pages in the report by either clicking on the pages listed below, or by using the keyword search tool below to find specific information within the annual report.-
 1
1 -
2
-
3
-
4
-
5
-
6
-
7
-
8
-
9
-
 10
10 -
 11
11 -
 12
12 -
 13
13 -
 14
14 -
 15
15 -
 16
16 -
 17
17 -
 18
18 -
 19
19 -
 20
20 -
 21
21 -
 22
22 -
 23
23 -
 24
24 -
 25
25 -
 26
26 -
 27
27 -
 28
28 -
 29
29 -
 30
30 -
31
-
32
-
33
-
34
-
35
-
36
-
37
-
38
-
39
-
40
-
41
-
42
-
43
-
44
-
45
-
46
-
47
-
48
-
49
-
50
-
51
-
52
-
53
-
54
-
55
-
56
-
57
-
58
-
59
-
60
-
61
-
62
-
63
-
64
-
65
-
66
-
67
-
68
-
69
-
70
-
71
-
72
-
73
-
74
-
75
-
76
-
77
-
78
-
79
-
80
-
81
-
82
-
83
-
84
-
85
-
86
-
87
 |
 |

by consumers. Our Entertainment and Devices Division is particularly seasonal as its products are aimed at the consumer
market and are in highest demand during the holiday shopping season. Typically, the Entertainment and Devices Division
has generated approximately 40% of its yearly segment revenue in our second fiscal quarter.
Unearned Revenue
Quarterly and annual revenue may be impacted by the deferral of revenue. See the discussions below regarding sales of
earlier versions of the Microsoft Office system with a guarantee to be upgraded to the newest version of the Microsoft
Office system at minimal or no cost (the “Office Deferral”), sales of Windows Vista with a guarantee to be upgraded to
Windows 7 at minimal or no cost (the “Windows 7 Deferral”), and sales of Windows 7 with an option to upgrade to
Windows 8 Pro at a discounted price (the “Windows Upgrade Offer”).
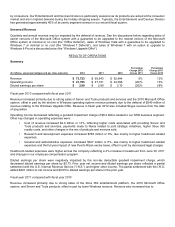
RESULTS OF OPERATIONS
Summary
(In millions, except percentages and per share amounts)
2012
2011
2010
Percentage
Change 2012
Versus 2011
Percentage
Change 2011
Versus 2010
Revenue
$
73,723
$
69,943
$
62,484
5%
12%
Operating income
$
21,763
$
27,161
$
24,098
(20)%
13%
Diluted earnings per share
$
2.00
$
2.69
$
2.10
(26)%
28%
Fiscal year 2012 compared with fiscal year 2011
Revenue increased primarily due to strong sales of Server and Tools products and services and the 2010 Microsoft Office
system, offset in part by the decline in Windows operating system revenue primarily due to the deferral of $540 million of
revenue relating to the Windows Upgrade Offer. Revenue in fiscal year 2012 also included Skype revenue from the date
of acquisition.
Operating income decreased reflecting a goodwill impairment charge of $6.2 billion related to our OSD business segment.
Other key changes in operating expenses were:
• Cost of revenue increased $2.0 billion or 13%, reflecting higher costs associated with providing Server and
Tools products and services, payments made to Nokia related to joint strategic initiatives, higher Xbox 360
royalty costs, and other changes in the mix of products and services sold.
• Research and development expenses increased $768 million or 8%, due mainly to higher headcount-related
expenses.
• General and administrative expenses increased $347 million or 8%, due mainly to higher headcount-related
expenses and the full year impact of new Puerto Rican excise taxes, offset in part by decreased legal charges.
Headcount-related expenses were higher across the company reflecting a 4% increase in headcount from June 30, 2011
and changes in our employee compensation program.
Diluted earnings per share were negatively impacted by the non-tax deductible goodwill impairment charge, which
decreased diluted earnings per share by $0.73. Prior year net income and diluted earnings per share reflected a partial
settlement with the U.S. Internal Revenue Service (“I.R.S.”) and higher other income. The partial settlement with the I.R.S.
added $461 million to net income and $0.05 to diluted earnings per share in the prior year.
Fiscal year 2011 compared with fiscal year 2010
Revenue increased primarily due to strong sales of the Xbox 360 entertainment platform, the 2010 Microsoft Office
system, and Server and Tools products, offset in part by lower Windows revenue. Revenue also increased due to