Microsoft 2012 Annual Report Download - page 30
Download and view the complete annual report
Please find page 30 of the 2012 Microsoft annual report below. You can navigate through the pages in the report by either clicking on the pages listed below, or by using the keyword search tool below to find specific information within the annual report.-
 1
1 -
2
-
3
-
4
-
5
-
6
-
7
-
8
-
9
-
10
-
11
-
12
-
13
-
14
-
15
-
16
-
17
-
18
-
19
-
 20
20 -
 21
21 -
 22
22 -
 23
23 -
 24
24 -
 25
25 -
 26
26 -
 27
27 -
 28
28 -
 29
29 -
 30
30 -
 31
31 -
 32
32 -
 33
33 -
 34
34 -
 35
35 -
 36
36 -
 37
37 -
 38
38 -
 39
39 -
 40
40 -
41
-
42
-
43
-
44
-
45
-
46
-
47
-
48
-
49
-
50
-
51
-
52
-
53
-
54
-
55
-
56
-
57
-
58
-
59
-
60
-
61
-
62
-
63
-
64
-
65
-
66
-
67
-
68
-
69
-
70
-
71
-
72
-
73
-
74
-
75
-
76
-
77
-
78
-
79
-
80
-
81
-
82
-
83
-
84
-
85
-
86
-
87
 |
 |

In addition, our effective tax rate was lower than in the prior year due to a partial settlement with the I.R.S. in the third
quarter of fiscal year 2011 relating to the audit of tax years 2004 to 2006. This partial settlement reduced our income tax
expense for fiscal year 2011 by $461 million.
FINANCIAL CONDITION
Cash, Cash Equivalents, and Investments
Cash, cash equivalents, and short-term investments totaled $63.0 billion as of June 30, 2012, compared with $52.8 billion
as of June 30, 2011. Equity and other investments were $9.8 billion as of June 30, 2012, compared with $10.9 billion as of
June 30, 2011. Our short-term investments are primarily to facilitate liquidity and for capital preservation. They consist
predominantly of highly liquid investment-grade fixed-income securities, diversified among industries and individual
issuers. The investments are predominantly U.S. dollar-denominated securities, but also include foreign currency-
denominated securities in order to diversify risk. Our fixed-income investments are exposed to interest rate risk and credit
risk. The credit risk and average maturity of our fixed-income portfolio are managed to achieve economic returns that
correlate to certain fixed-income indices. The settlement risk related to these investments is insignificant given that the
short-term investments held are primarily highly liquid investment-grade fixed-income securities. While we own certain
mortgage-backed and asset-backed fixed-income securities, our portfolio as of June 30, 2012 does not contain direct
exposure to subprime mortgages or structured vehicles that derive their value from subprime collateral. The majority of
our mortgage-backed securities are collateralized by prime residential mortgages and carry a 100% principal and interest
guarantee, primarily from Federal National Mortgage Association, Federal Home Loan Mortgage Corporation, and
Government National Mortgage Association.
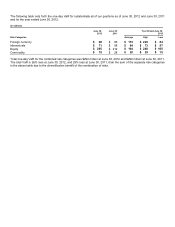
We routinely monitor our financial exposure to both sovereign and non-sovereign borrowers and counterparties. Our gross
exposures to our customers and investments in Portugal, Italy, Ireland, Greece, and Spain are individually and collectively
not material.
Of the cash, cash equivalents, and short-term investments at June 30, 2012, approximately $54 billion was held by our
foreign subsidiaries and would be subject to material repatriation tax effects. The amount of cash and investments held by
foreign subsidiaries subject to other restrictions on the free flow of funds (primarily currency and other local regulatory)
was approximately $660 million. As of June 30, 2012, approximately 77% of the short-term investments held by our
foreign subsidiaries were invested in U.S. government and agency securities, approximately 10% were invested in
corporate notes and bonds of U.S. companies, and 3% were invested in U.S. mortgage-backed securities, all of which are
denominated in U.S. dollars.
Securities lending
We lend certain fixed-income and equity securities to increase investment returns. The loaned securities continue to be
carried as investments on our balance sheet. Cash and/or security interests are received as collateral for the loaned
securities with the amount determined based upon the underlying security lent and the creditworthiness of the borrower.
Cash received is recorded as an asset with a corresponding liability. Our securities lending payable balance was $814
million as of June 30, 2012. Our average and maximum securities lending payable balances for the fiscal year were $1.2
billion and $1.4 billion, respectively. Intra-year variances in the amount of securities loaned are mainly due to fluctuations
in the demand for the securities.
Valuation
In general, and where applicable, we use quoted prices in active markets for identical assets or liabilities to determine the
fair value of our financial instruments. This pricing methodology applies to our Level 1 investments, such as exchange-
traded mutual funds, domestic and international equities, and U.S. treasuries. If quoted prices in active markets for
identical assets or liabilities are not available to determine fair value, then we use quoted prices for similar assets and
liabilities or inputs other than the quoted prices that are observable either directly or indirectly.