Microsoft 2012 Annual Report Download - page 59
Download and view the complete annual report
Please find page 59 of the 2012 Microsoft annual report below. You can navigate through the pages in the report by either clicking on the pages listed below, or by using the keyword search tool below to find specific information within the annual report.-
 1
1 -
2
-
3
-
4
-
5
-
6
-
7
-
8
-
9
-
10
-
11
-
12
-
13
-
14
-
15
-
16
-
17
-
18
-
19
-
20
-
21
-
22
-
23
-
24
-
25
-
26
-
27
-
28
-
29
-
30
-
31
-
32
-
33
-
34
-
35
-
36
-
37
-
38
-
39
-
40
-
41
-
42
-
43
-
44
-
45
-
46
-
47
-
48
-
 49
49 -
 50
50 -
 51
51 -
 52
52 -
 53
53 -
 54
54 -
 55
55 -
 56
56 -
 57
57 -
 58
58 -
 59
59 -
 60
60 -
 61
61 -
 62
62 -
 63
63 -
 64
64 -
 65
65 -
 66
66 -
 67
67 -
 68
68 -
 69
69 -
70
-
71
-
72
-
73
-
74
-
75
-
76
-
77
-
78
-
79
-
80
-
81
-
82
-
83
-
84
-
85
-
86
-
87
 |
 |

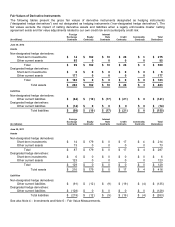
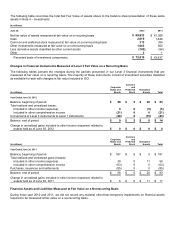
The following table reconciles the total Net Fair Value of assets above to the balance sheet presentation of these same
assets in Note 4 – Investments.
(In millions)
June 30,
2012
2011
Net fair value of assets measured at fair value on a recurring basis
$
69,623
$
61,058
Cash
2,019
1,648
Common and preferred stock measured at fair value on a nonrecurring basis
313
334
Other investments measured at fair value on a nonrecurring basis
1,043
650
Less derivative assets classified as other current assets
(185
)
(54
)
Other
3
1
Recorded basis of investment components
$
72,816
$
63,637
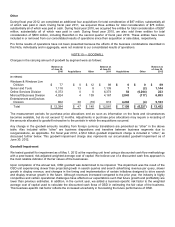
Changes in Financial Instruments Measured at Level 3 Fair Value on a Recurring Basis
The following tables present the changes during the periods presented in our Level 3 financial instruments that are
measured at fair value on a recurring basis. The majority of these instruments consist of investment securities classified
as available-for-sale with changes in fair value included in OCI.
(In millions)
Corporate
Notes and
Bonds
Common
and
Preferred
Stock
Derivative
Assets
Total
Year Ended June 30, 2012
Balance, beginning of period
$
58
$
5
$
20
$
83
Total realized and unrealized losses:
Included in other income (expense)
0
0
(5
)
(5
)
Included in other comprehensive income
(21
)
0
0
(21
)
Conversions of Level 3 instruments to Level 1 instruments
(28
)
0
(15
)
(43
)
Balance, end of period
$
9
$
5
$
0
$
14
Change in unrealized gains included in other income (expense) related to
assets held as of June 30, 2012
$
0
$
0
$
0
$
0
(In millions)
Corporate
Notes and
Bonds
Common
and
Preferred
Stock
Derivative
Assets
Total
Year Ended June 30, 2011
Balance, beginning of period
$
167
$
5
$
9
$
181
Total realized and unrealized gains (losses):
Included in other income (expense)
39
0
11
50
Included in other comprehensive income
(63
)
0
0
(63
)
Purchases, issuances and settlements
(85
)
0
0
(85
)
Balance, end of period
$
58
$
5
$
20
$
83
Change in unrealized gains included in other income (expense) related to
assets held as of June 30, 2011
$
6
$
0
$
11
$
17
Financial Assets and Liabilities Measured at Fair Value on a Nonrecurring Basis
During fiscal year 2012 and 2011, we did not record any material other-than-temporary impairments on financial assets
required to be measured at fair value on a nonrecurring basis.