Microsoft 2012 Annual Report Download - page 31
Download and view the complete annual report
Please find page 31 of the 2012 Microsoft annual report below. You can navigate through the pages in the report by either clicking on the pages listed below, or by using the keyword search tool below to find specific information within the annual report.-
 1
1 -
2
-
3
-
4
-
5
-
6
-
7
-
8
-
9
-
10
-
11
-
12
-
13
-
14
-
15
-
16
-
17
-
18
-
19
-
20
-
 21
21 -
 22
22 -
 23
23 -
 24
24 -
 25
25 -
 26
26 -
 27
27 -
 28
28 -
 29
29 -
 30
30 -
 31
31 -
 32
32 -
 33
33 -
 34
34 -
 35
35 -
 36
36 -
 37
37 -
 38
38 -
 39
39 -
 40
40 -
 41
41 -
42
-
43
-
44
-
45
-
46
-
47
-
48
-
49
-
50
-
51
-
52
-
53
-
54
-
55
-
56
-
57
-
58
-
59
-
60
-
61
-
62
-
63
-
64
-
65
-
66
-
67
-
68
-
69
-
70
-
71
-
72
-
73
-
74
-
75
-
76
-
77
-
78
-
79
-
80
-
81
-
82
-
83
-
84
-
85
-
86
-
87
 |
 |
This pricing methodology applies to our Level 2 investments such as corporate notes and bonds, foreign government
bonds, mortgage-backed securities, and agency securities. Level 3 investments are valued using internally developed
models with unobservable inputs. Assets and liabilities measured using unobservable inputs are an immaterial portion of
our portfolio.
A majority of our investments are priced by pricing vendors and are generally Level 1 or Level 2 investments as these
vendors either provide a quoted market price in an active market or use observable inputs for their pricing without
applying significant adjustments. Broker pricing is used mainly when a quoted price is not available, the investment is not
priced by our pricing vendors, or when a broker price is more reflective of fair values in the market in which the investment
trades. Our broker-priced investments are generally labeled as Level 2 investments because the broker prices these
investments based on similar assets without applying significant adjustments. In addition, all of our broker-priced
investments have a sufficient level of trading volume to demonstrate that the fair values used are appropriate for these
investments. Our fair value processes include controls that are designed to ensure appropriate fair values are recorded.
These controls include model validation, review of key model inputs, analysis of period-over-period fluctuations, and
independent recalculation of prices where appropriate.
Cash Flows
Fiscal year 2012 compared with fiscal year 2011
Cash flows from operations increased $4.6 billion during the current fiscal year to $31.6 billion due mainly to increased
revenue and cash collections from customers. Cash used for financing increased $1.0 billion to $9.4 billion due mainly to
a $6.0 billion net decrease in proceeds from issuances of debt and a $1.2 billion increase in dividends paid, offset in part
by a $6.5 billion decrease in cash used for common stock repurchases. Cash used in investing increased $10.2 billion to
$24.8 billion due mainly to a $10.0 billion increase in acquisitions of businesses and purchases of intangible assets and a
$1.4 billion decrease in cash from securities lending activities, partially offset by a $1.2 billion decrease in cash used for
net purchases, maturities, and sales of investments.
Fiscal year 2011 compared with fiscal year 2010
Cash flows from operations increased $2.9 billion during the current fiscal year to $27.0 billion due mainly to increased
revenue and cash collections from customers. Cash used in financing decreased $4.9 billion to $8.4 billion due mainly to a
$5.8 billion increase in proceeds from issuance of debt, net of repayments, offset in part by a $602 million increase in
cash paid for dividends. Cash used in investing increased $3.3 billion to $14.6 billion due to a $5.8 billion increase in
purchases of investments, offset in part by a $2.5 billion increase in cash from securities lending.
Debt
We issued debt in prior periods to take advantage of favorable pricing and liquidity in the debt markets, reflecting our
credit rating and the low interest rate environment. The proceeds of these issuances were used to partially fund
discretionary business acquisitions and share repurchases.
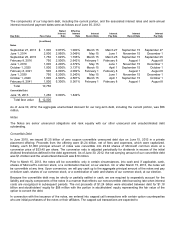
As of June 30, 2012, the total carrying value and estimated fair value of our long-term debt, including the current portion,
were $11.9 billion and $13.2 billion, respectively. This is compared with a carrying value and estimated fair value of $11.9
billion and $12.1 billion, respectively, as of June 30, 2011. These estimated fair values are based on Level 2 inputs.