Microsoft 2012 Annual Report Download - page 76
Download and view the complete annual report
Please find page 76 of the 2012 Microsoft annual report below. You can navigate through the pages in the report by either clicking on the pages listed below, or by using the keyword search tool below to find specific information within the annual report.-
 1
1 -
2
-
3
-
4
-
5
-
6
-
7
-
8
-
9
-
10
-
11
-
12
-
13
-
14
-
15
-
16
-
17
-
18
-
19
-
20
-
21
-
22
-
23
-
24
-
25
-
26
-
27
-
28
-
29
-
30
-
31
-
32
-
33
-
34
-
35
-
36
-
37
-
38
-
39
-
40
-
41
-
42
-
43
-
44
-
45
-
46
-
47
-
48
-
49
-
50
-
51
-
52
-
53
-
54
-
55
-
56
-
57
-
58
-
59
-
60
-
61
-
62
-
63
-
64
-
65
-
 66
66 -
 67
67 -
 68
68 -
 69
69 -
 70
70 -
 71
71 -
 72
72 -
 73
73 -
 74
74 -
 75
75 -
 76
76 -
 77
77 -
 78
78 -
 79
79 -
 80
80 -
 81
81 -
 82
82 -
 83
83 -
 84
84 -
 85
85 -
 86
86 -
87
 |
 |

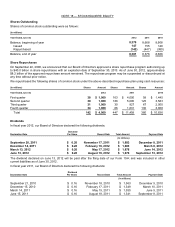
During fiscal year 2012, the following activity occurred under our stock plans:
Shares
Weighted
Average
Grant-Date
Fair Value
(In millions)
Stock Awards
Nonvested balance, beginning of year
255
$
23.59
Granted
90
$
24.96
Vested
(73
)
$
24.20
Forfeited
(24
)
$
23.74
Nonvested balance, end of year
248
$
23.90
Shared Performance Stock Awards
Nonvested balance, beginning of year
32
$
23.76
Granted
20
$
22.88
Vested
(15
)
$
24.69
Forfeited
(4
)
$
23.82
Nonvested balance, end of year
33
$
23.93
As of June 30, 2012, there was $4.4 billion and $495 million of total unrecognized compensation costs related to SAs and
SPSAs, respectively. These costs are expected to be recognized over a weighted average period of 2.9 years and 2.5
years, respectively.
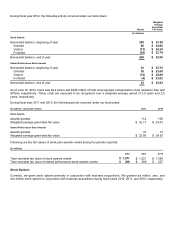
During fiscal year 2011 and 2010, the following activity occurred under our stock plans:
(In millions, except fair values)
2011
2010
Stock Awards
Awards granted
114
100
Weighted average grant-date fair value
$
22.17
$
23.43
Shared Performance Stock Awards
Awards granted
18
12
Weighted average grant-date fair value
$
22.56
$
24.57
Following are the fair values of stock plan awards vested during the periods reported:
(In millions)
2012
2011
2010
Total vest-date fair value of stock awards vested
$
1,971
$
1,521
$
1,358
Total vest-date fair value of shared performance stock awards vested
$
388
$
289
$
227
Stock Options
Currently, we grant stock options primarily in conjunction with business acquisitions. We granted six million, zero, and
one million stock options in conjunction with business acquisitions during fiscal years 2012, 2011, and 2010, respectively.