Microsoft 2012 Annual Report Download - page 62
Download and view the complete annual report
Please find page 62 of the 2012 Microsoft annual report below. You can navigate through the pages in the report by either clicking on the pages listed below, or by using the keyword search tool below to find specific information within the annual report.-
 1
1 -
2
-
3
-
4
-
5
-
6
-
7
-
8
-
9
-
10
-
11
-
12
-
13
-
14
-
15
-
16
-
17
-
18
-
19
-
20
-
21
-
22
-
23
-
24
-
25
-
26
-
27
-
28
-
29
-
30
-
31
-
32
-
33
-
34
-
35
-
36
-
37
-
38
-
39
-
40
-
41
-
42
-
43
-
44
-
45
-
46
-
47
-
48
-
49
-
50
-
51
-
 52
52 -
 53
53 -
 54
54 -
 55
55 -
 56
56 -
 57
57 -
 58
58 -
 59
59 -
 60
60 -
 61
61 -
 62
62 -
 63
63 -
 64
64 -
 65
65 -
 66
66 -
 67
67 -
 68
68 -
 69
69 -
 70
70 -
 71
71 -
 72
72 -
73
-
74
-
75
-
76
-
77
-
78
-
79
-
80
-
81
-
82
-
83
-
84
-
85
-
86
-
87
 |
 |

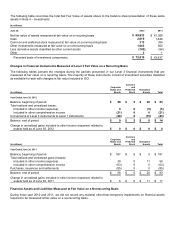
Because our annual test indicated that OSD’s carrying value exceeded its estimated fair value, a second phase of the
goodwill impairment test (“Step 2”) was performed specific to OSD. Under Step 2, the fair value of all OSD assets and
liabilities were estimated, including tangible assets, existing technology, trade names, and partner relationships for the
purpose of deriving an estimate of the implied fair value of goodwill. The implied fair value of the goodwill was then
compared to the recorded goodwill to determine the amount of the impairment. Assumptions used in measuring the value
of these assets and liabilities included the discount rates, royalty rates, and obsolescence rates used in valuing the
intangible assets, and pricing of comparable transactions in the market in valuing the tangible assets.
No other instances of impairment were identified in our May 1, 2012 test.
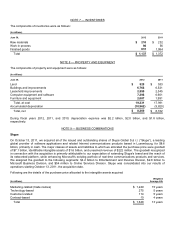
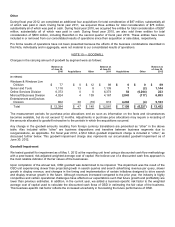
NOTE 11 — INTANGIBLE ASSETS
The components of intangible assets, all of which are finite-lived, were as follows:
(In millions)
Gross
Carrying
Amount
Accumulated
Amortization
Net Carrying
Amount
Gross
Carrying
Amount
Accumulated
Amortization
Net
Carrying
Amount
Year Ended June 30,
2012
2011
Technology-based
(a)
$
3,550
$
(1,899
)
$
1,651
$
2,356
$
(1,831
)
$
525
Marketing-related
1,325
(136
)
1,189
113
(98
)
15
Contract-based
824
(644
)
180
1,068
(966
)
102
Customer-related
408
(258
)
150
326
(224
)
102
Total
$
6,107
$
(2,937
)
$
3,170
$
3,863
$
(3,119
)
$
744
(a) Technology-based intangible assets included $177 million and $179 million as of June 30, 2012 and 2011,
respectively, of net carrying amount of software to be sold, leased, or otherwise marketed.
We estimate that we have no significant residual value related to our intangible assets. No material impairments of
intangible assets were identified during any of the periods presented.
The components of intangible assets acquired during the periods presented were as follows:
(In millions)
Amount
Weighted
Average Life
Amount
Weighted
Average Life
Year Ended June 30,
2012
2011
Technology-based
$
1,548
7 years
$
119
3 years
Marketing-related
1,249
15 years
1
7 years
Contract-based
115
7 years
0
Customer-related
114
5 years
2
4 years
Total
$
3,026
10 years
$
122
3 years
Intangible assets amortization expense was $558 million, $537 million, and $707 million for fiscal years 2012, 2011, and
2010, respectively. Amortization of capitalized software was $117 million, $114 million, and $97 million for fiscal years
2012, 2011, and 2010, respectively.