Microsoft 2012 Annual Report Download - page 28
Download and view the complete annual report
Please find page 28 of the 2012 Microsoft annual report below. You can navigate through the pages in the report by either clicking on the pages listed below, or by using the keyword search tool below to find specific information within the annual report.-
 1
1 -
2
-
3
-
4
-
5
-
6
-
7
-
8
-
9
-
10
-
11
-
12
-
13
-
14
-
15
-
16
-
17
-
 18
18 -
 19
19 -
 20
20 -
 21
21 -
 22
22 -
 23
23 -
 24
24 -
 25
25 -
 26
26 -
 27
27 -
 28
28 -
 29
29 -
 30
30 -
 31
31 -
 32
32 -
 33
33 -
 34
34 -
 35
35 -
 36
36 -
 37
37 -
 38
38 -
39
-
40
-
41
-
42
-
43
-
44
-
45
-
46
-
47
-
48
-
49
-
50
-
51
-
52
-
53
-
54
-
55
-
56
-
57
-
58
-
59
-
60
-
61
-
62
-
63
-
64
-
65
-
66
-
67
-
68
-
69
-
70
-
71
-
72
-
73
-
74
-
75
-
76
-
77
-
78
-
79
-
80
-
81
-
82
-
83
-
84
-
85
-
86
-
87
 |
 |

Fiscal year 2011 compared with fiscal year 2010
General and administrative expenses increased, primarily due to a 12% increase in headcount-related expenses and new
Puerto Rican excise taxes, partially offset by prior year transition expenses associated with the inception of the Yahoo!
Commercial Agreement.
Goodwill Impairment
We conducted our annual goodwill impairment test as of May 1, 2012 for all reporting units. This test, which was based on
our most recent cash flow forecast, indicated that OSD’s carrying value exceeded its estimated fair value. Accordingly, we
recorded a non-cash, non-tax deductible goodwill impairment charge of $6.2 billion during the three months ended
June 30, 2012, reducing OSD’s goodwill from $6.4 billion to $223 million.
OTHER INCOME (EXPENSE) AND INCOME TAXES
Other Income (Expense)
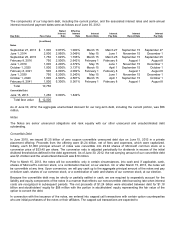
The components of other income (expense) were as follows:
(In millions)
Year Ended June 30,
2012
2011
2010
Dividends and interest income
$
800
$
900
$
843
Interest expense
(380
)
(295
)
(151
)
Net recognized gains on investments
564
439
348
Net losses on derivatives
(364
)
(77
)
(140
)
Net gains (losses) on foreign currency remeasurements
(117
)
(26
)
1
Other
1
(31
)
14
Total
$
504
$
910
$
915
We use derivative instruments to manage risks related to foreign currencies, equity prices, interest rates, and credit; to
enhance investment returns; and to facilitate portfolio diversification. Gains and losses from changes in fair values of
derivatives that are not designated as hedges are recognized in other income (expense). These are generally offset by
unrealized gains and losses in the underlying securities in the investment portfolio and are recorded as a component of
other comprehensive income.
Fiscal year 2012 compared with fiscal year 2011
Dividends and interest income decreased due to lower yields on our fixed-income investments, offset in part by higher
average portfolio investment balances. Interest expense increased due to our increased issuance of debt in the prior year.
Net recognized gains on investments increased, primarily due to higher gains on sales of equity and fixed-income
securities and a gain recognized on the partial sale of our Facebook holding upon the initial public offering on May 18,
2012, offset in part by higher other-than-temporary impairments. Other-than-temporary impairments were $298 million in
fiscal year 2012, compared with $80 million in fiscal year 2011. Net losses on derivatives increased due to losses on
commodity and equity derivatives in the current fiscal year as compared with gains in the prior fiscal year, offset in part by
fewer losses on foreign exchange contracts in the current fiscal year as compared to the prior fiscal year. Changes in
foreign currency remeasurements were primarily due to currency movements net of our hedging activities.
Fiscal year 2011 compared with fiscal year 2010
Dividends and interest income increased due to higher average portfolio investment balances, offset in part by lower
yields on our fixed-income investments. Interest expense increased due to our increased issuance of debt. Net