Microsoft 2012 Annual Report Download - page 61
Download and view the complete annual report
Please find page 61 of the 2012 Microsoft annual report below. You can navigate through the pages in the report by either clicking on the pages listed below, or by using the keyword search tool below to find specific information within the annual report.-
 1
1 -
2
-
3
-
4
-
5
-
6
-
7
-
8
-
9
-
10
-
11
-
12
-
13
-
14
-
15
-
16
-
17
-
18
-
19
-
20
-
21
-
22
-
23
-
24
-
25
-
26
-
27
-
28
-
29
-
30
-
31
-
32
-
33
-
34
-
35
-
36
-
37
-
38
-
39
-
40
-
41
-
42
-
43
-
44
-
45
-
46
-
47
-
48
-
49
-
50
-
 51
51 -
 52
52 -
 53
53 -
 54
54 -
 55
55 -
 56
56 -
 57
57 -
 58
58 -
 59
59 -
 60
60 -
 61
61 -
 62
62 -
 63
63 -
 64
64 -
 65
65 -
 66
66 -
 67
67 -
 68
68 -
 69
69 -
 70
70 -
 71
71 -
72
-
73
-
74
-
75
-
76
-
77
-
78
-
79
-
80
-
81
-
82
-
83
-
84
-
85
-
86
-
87
 |
 |

Other
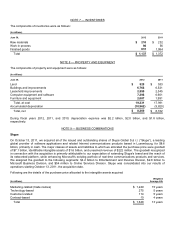
During fiscal year 2012, we completed an additional four acquisitions for total consideration of $87 million, substantially all
of which was paid in cash. During fiscal year 2011, we acquired three entities for total consideration of $75 million,
substantially all of which was paid in cash. During fiscal year 2010, we acquired five entities for total consideration of $267
million, substantially all of which was paid in cash. During fiscal year 2010, we also sold three entities for total
consideration of $600 million, including Razorfish in the second quarter of fiscal year 2010. These entities have been
included in or removed from our consolidated results of operations since their acquisition or sale dates, respectively.
Pro forma results of operations have not been presented because the effects of the business combinations described in
this Note, individually and in aggregate, were not material to our consolidated results of operations.
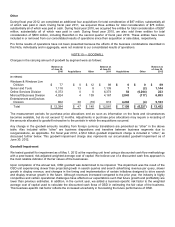
NOTE 10 — GOODWILL
Changes in the carrying amount of goodwill by segment were as follows:
Balance as
of June 30,
2010
Acquisitions
Other
Balance as
of June 30,
2011
Acquisitions
Other
Balance as
of June 30,
2012
(In millions)
Windows & Windows Live
Division
$
77
$
0
$
12
$
89
$
0
$
0
$
89
Server and Tools
1,118
13
8
1,139
7
(2
)
1,144
Online Services Division
6,373
0
0
6,373
54
(6,204
)
223
Microsoft Business Division
4,024
4
139
4,167
2,843
(117
)
6,893
Entertainment and Devices
Division
802
30
(19
)
813
4,294
(4
)
5,103
Total
$
12,394
$
47
$
140
$
12,581
$
7,198
$
(6,327
)
$
13,452
The measurement periods for purchase price allocations end as soon as information on the facts and circumstances
becomes available, but do not exceed 12 months. Adjustments in purchase price allocations may require a recasting of
the amounts allocated to goodwill retroactive to the periods in which the acquisitions occurred.
Any change in the goodwill amounts resulting from foreign currency translations are presented as “other” in the above
table. Also included within “other” are business dispositions and transfers between business segments due to
reorganizations, as applicable. For fiscal year 2012, a $6.2 billion goodwill impairment charge is included in “other,” as
discussed further below. This goodwill impairment charge also represents our accumulated goodwill impairment as of
June 30, 2012.
Goodwill Impairment
We tested goodwill for impairment as of May 1, 2012 at the reporting unit level using a discounted cash flow methodology
with a peer-based, risk-adjusted weighted average cost of capital. We believe use of a discounted cash flow approach is
the most reliable indicator of the fair values of the businesses.
Upon completion of the annual test, OSD goodwill was determined to be impaired. The impairment was the result of the
OSD unit experiencing slower than projected growth in search queries and search advertising revenue per query, slower
growth in display revenue, and changes in the timing and implementation of certain initiatives designed to drive search
and display revenue growth in the future. Although revenues increased compared to the prior year, the industry is highly
competitive and certain operational challenges have affected our expectations such that future growth and profitability are
lower than previous estimates. In addition, in the current year, we added a business-specific risk factor to the weighted
average cost of capital used to calculate the discounted cash flows of OSD in estimating the fair value of the business.
This business-specific risk factor reflects the increased uncertainty in forecasting the future performance of OSD.