Microsoft 2012 Annual Report Download - page 52
Download and view the complete annual report
Please find page 52 of the 2012 Microsoft annual report below. You can navigate through the pages in the report by either clicking on the pages listed below, or by using the keyword search tool below to find specific information within the annual report.-
 1
1 -
2
-
3
-
4
-
5
-
6
-
7
-
8
-
9
-
10
-
11
-
12
-
13
-
14
-
15
-
16
-
17
-
18
-
19
-
20
-
21
-
22
-
23
-
24
-
25
-
26
-
27
-
28
-
29
-
30
-
31
-
32
-
33
-
34
-
35
-
36
-
37
-
38
-
39
-
40
-
41
-
 42
42 -
 43
43 -
 44
44 -
 45
45 -
 46
46 -
 47
47 -
 48
48 -
 49
49 -
 50
50 -
 51
51 -
 52
52 -
 53
53 -
 54
54 -
 55
55 -
 56
56 -
 57
57 -
 58
58 -
 59
59 -
 60
60 -
 61
61 -
 62
62 -
63
-
64
-
65
-
66
-
67
-
68
-
69
-
70
-
71
-
72
-
73
-
74
-
75
-
76
-
77
-
78
-
79
-
80
-
81
-
82
-
83
-
84
-
85
-
86
-
87
 |
 |

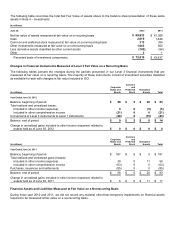
Following are details of net recognized gains on investments during the periods reported:
(In millions)
Year Ended June 30,
2012
2011
2010
Other-than-temporary impairments of investments
$
(298
)
$
(80
)
$
(69
)
Realized gains from sales of available-for-sale securities
1,418
734
605
Realized losses from sales of available-for-sale securities
(556
)
(215
)
(188
)
Total
$
564
$
439
$
348
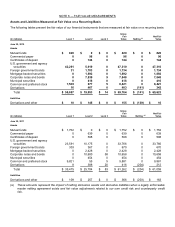
NOTE 4 — INVESTMENTS
Investment Components
The components of investments, including associated derivatives, were as follows:
(In millions)
Cost Basis
Unrealized
Gains
Unrealized
Losses
Recorded
Basis
Cash
and Cash
Equivalents
Short-term
Investments
Equity
and Other
Investments
June 30, 2012
Cash
$
2,019
$
0
$
0
$
2,019
$
2,019
$
0
$
0
Mutual funds
820
0
0
820
820
0
0
Commercial paper
96
0
0
96
96
0
0
Certificates of deposit
744
0
0
744
342
402
0
U.S. government and
agency securities
47,178
130
(2
)
47,306
561
46,745
0
Foreign government bonds
1,741
18
(29
)
1,730
575
1,155
0
Mortgage-backed
securities
1,816
82
(2
)
1,896
0
1,896
0
Corporate notes and bonds
7,799
224
(15
)
8,008
2,525
5,483
0
Municipal securities
358
58
0
416
0
416
0
Common and preferred
stock
6,965
2,204
(436
)
8,733
0
0
8,733
Other investments
1,048
0
0
1,048
0
5
1,043
Total
$
70,584
$
2,716
$
(484
)
$
72,816
$
6,938
$
56,102
$
9,776
(In millions)
Cost Basis
Unrealized
Gains
Unrealized
Losses
Recorded
Basis
Cash
and Cash
Equivalents
Short-term
Investments
Equity
and Other
Investments
June 30, 2011
Cash
$
1,648
$
0
$
0
$
1,648
$
1,648
$
0
$
0
Mutual funds
1,752
0
0
1,752
1,752
0
0
Commercial paper
639
0
0
639
414
225
0
Certificates of deposit
598
0
0
598
372
226
0
U.S. government and
agency securities
33,607
162
(7
)
33,762
2,049
31,713
0
Foreign government bonds
658
11
(2
)
667
0
667
0
Mortgage-backed
securities
2,307
121
(4
)
2,424
0
2,424
0
Corporate notes and bonds
10,575
260
(11
)
10,824
3,375
7,449
0
Municipal securities
441
15
(2
)
454
0
454
0
Common and preferred
stock
7,925
2,483
(193
)
10,215
0
0
10,215
Other investments
654
0
0
654
0
4
650
Total
$
60,804
$
3,052
$
(219
)
$
63,637
$
9,610
$
43,162
$
10,865