Microsoft 2012 Annual Report Download - page 53
Download and view the complete annual report
Please find page 53 of the 2012 Microsoft annual report below. You can navigate through the pages in the report by either clicking on the pages listed below, or by using the keyword search tool below to find specific information within the annual report.-
 1
1 -
2
-
3
-
4
-
5
-
6
-
7
-
8
-
9
-
10
-
11
-
12
-
13
-
14
-
15
-
16
-
17
-
18
-
19
-
20
-
21
-
22
-
23
-
24
-
25
-
26
-
27
-
28
-
29
-
30
-
31
-
32
-
33
-
34
-
35
-
36
-
37
-
38
-
39
-
40
-
41
-
42
-
 43
43 -
 44
44 -
 45
45 -
 46
46 -
 47
47 -
 48
48 -
 49
49 -
 50
50 -
 51
51 -
 52
52 -
 53
53 -
 54
54 -
 55
55 -
 56
56 -
 57
57 -
 58
58 -
 59
59 -
 60
60 -
 61
61 -
 62
62 -
 63
63 -
64
-
65
-
66
-
67
-
68
-
69
-
70
-
71
-
72
-
73
-
74
-
75
-
76
-
77
-
78
-
79
-
80
-
81
-
82
-
83
-
84
-
85
-
86
-
87
 |
 |
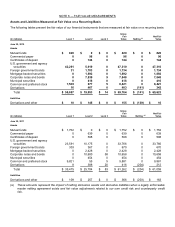
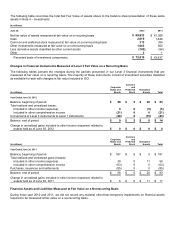
Unrealized Losses on Investments
Investments with continuous unrealized losses for less than 12 months and 12 months or greater and their related fair
values were as follows:
Less than 12 Months
12 Months or Greater
Total
Unrealized
Losses
(In millions)
Fair Value
Unrealized
Losses
Fair Value
Unrealized
Losses
Total
Fair Value
June 30, 2012
U.S. government and agency securities
$
44
$
(2
)
$
0
$
0
$
44
$
(2
)
Foreign government bonds
657
(27
)
12
(2
)
669
(29
)
Mortgage-backed securities
53
0
48
(2
)
101
(2
)
Corporate notes and bonds
640
(11
)
70
(4
)
710
(15
)
Common and preferred stock
2,135
(329
)
305
(107
)
2,440
(436
)
Total
$
3,529
$
(369
)
$
435
$
(115
)
$
3,964
$
(484
)
Less than 12 Months
12 Months or Greater
Total
Unrealized
Losses
(In millions)
Fair Value
Unrealized
Losses
Fair Value
Unrealized
Losses
Total
Fair Value
June 30, 2011
U.S. government and agency securities
$
484
$
(7
)
$
0
$
0
$
484
$
(7
)
Foreign government bonds
365
(2
)
0
0
365
(2
)
Mortgage-backed securities
63
(3
)
14
(1
)
77
(4
)
Corporate notes and bonds
750
(10
)
25
(1
)
775
(11
)
Municipal securities
79
(2
)
0
0
79
(2
)
Common and preferred stock
1,377
(146
)
206
(47
)
1,583
(193
)
Total
$
3,118
$
(170
)
$
245
$
(49
)
$
3,363
$
(219
)
Unrealized losses from fixed-income securities are primarily attributable to changes in interest rates. Unrealized losses
from domestic and international equities are due to market price movements. Management does not believe any
remaining unrealized losses represent other-than-temporary impairments based on our evaluation of available evidence
as of June 30, 2012.
At June 30, 2012 and 2011, the recorded bases of common and preferred stock and other investments that are restricted
for more than one year or are not publicly traded were $313 million and $334 million, respectively. These investments are
carried at cost and are reviewed quarterly for indicators of other-than-temporary impairment. It is not possible for us to
reliably estimate the fair value of these investments.
Debt Investment Maturities
(In millions)
Cost Basis
Estimated
Fair Value
June 30, 2012
Due in one year or less
$
23,097
$
23,125
Due after one year through five years
31,029
31,124
Due after five years through 10 years
3,173
3,371
Due after 10 years
2,433
2,576
Total
$
59,732
$
60,196