Microsoft 2012 Annual Report Download - page 63
Download and view the complete annual report
Please find page 63 of the 2012 Microsoft annual report below. You can navigate through the pages in the report by either clicking on the pages listed below, or by using the keyword search tool below to find specific information within the annual report.-
 1
1 -
2
-
3
-
4
-
5
-
6
-
7
-
8
-
9
-
10
-
11
-
12
-
13
-
14
-
15
-
16
-
17
-
18
-
19
-
20
-
21
-
22
-
23
-
24
-
25
-
26
-
27
-
28
-
29
-
30
-
31
-
32
-
33
-
34
-
35
-
36
-
37
-
38
-
39
-
40
-
41
-
42
-
43
-
44
-
45
-
46
-
47
-
48
-
49
-
50
-
51
-
52
-
 53
53 -
 54
54 -
 55
55 -
 56
56 -
 57
57 -
 58
58 -
 59
59 -
 60
60 -
 61
61 -
 62
62 -
 63
63 -
 64
64 -
 65
65 -
 66
66 -
 67
67 -
 68
68 -
 69
69 -
 70
70 -
 71
71 -
 72
72 -
 73
73 -
74
-
75
-
76
-
77
-
78
-
79
-
80
-
81
-
82
-
83
-
84
-
85
-
86
-
87
 |
 |

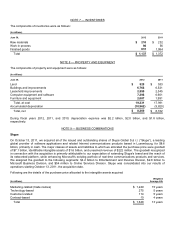
The following table outlines the estimated future amortization expense related to intangible assets held at June 30, 2012:
(In millions)
Year Ending June 30,
2013
$
597
2014
432
2015
367
2016
304
2017
234
Thereafter
1,236
Total
$
3,170
NOTE 12 — DEBT
As of June 30, 2012, the total carrying value and estimated fair value of our long-term debt, including the current portion,
were $11.9 billion and $13.2 billion, respectively. This is compared to a carrying value and estimated fair value of $11.9
billion and $12.1 billion, respectively, as of June 30, 2011. These estimated fair values are based on Level 2 inputs.
The components of our long-term debt, including the current portion, and the associated interest rates and semi-annual
interest record and payment dates were as follows as of June 30, 2012 and 2011:
Due Date
Face Value
Stated
Interest
Rate
Effective
Interest
Rate
Interest
Record Date
Interest
Pay Date
Interest
Record Date
Interest
Pay Date
(In millions)
Notes
September 27, 2013
$
1,000
0.875%
1.000%
March 15
March 27
September 15
September 27
June 1, 2014
2,000
2.950%
3.049%
May 15
June 1
November 15
December 1
September 25, 2015
1,750
1.625%
1.795%
March 15
March 25
September 15
September 25
February 8, 2016
750
2.500%
2.642%
February 1
February 8
August 1
August 8
June 1, 2019
1,000
4.200%
4.379%
May 15
June 1
November 15
December 1
October 1, 2020
1,000
3.000%
3.137%
March 15
April 1
September 15
October 1
February 8, 2021
500
4.000%
4.082%
February 1
February 8
August 1
August 8
June 1, 2039
750
5.200%
5.240%
May 15
June 1
November 15
December 1
October 1, 2040
1,000
4.500%
4.567%
March 15
April 1
September 15
October 1
February 8, 2041
1,000
5.300%
5.361%
February 1
February 8
August 1
August 8
Total
10,750
Convertible Debt
June 15, 2013
1,250
0.000%
1.849%
Total face value
$
12,000
As of June 30, 2012 and 2011, the aggregate unamortized discount for our long-term debt, including the current portion,
was $56 million and $79 million, respectively.
Notes
The Notes are senior unsecured obligations and rank equally with our other unsecured and unsubordinated debt
outstanding.