Microsoft 2012 Annual Report Download - page 22
Download and view the complete annual report
Please find page 22 of the 2012 Microsoft annual report below. You can navigate through the pages in the report by either clicking on the pages listed below, or by using the keyword search tool below to find specific information within the annual report.-
 1
1 -
2
-
3
-
4
-
5
-
6
-
7
-
8
-
9
-
10
-
11
-
 12
12 -
 13
13 -
 14
14 -
 15
15 -
 16
16 -
 17
17 -
 18
18 -
 19
19 -
 20
20 -
 21
21 -
 22
22 -
 23
23 -
 24
24 -
 25
25 -
 26
26 -
 27
27 -
 28
28 -
 29
29 -
 30
30 -
 31
31 -
 32
32 -
33
-
34
-
35
-
36
-
37
-
38
-
39
-
40
-
41
-
42
-
43
-
44
-
45
-
46
-
47
-
48
-
49
-
50
-
51
-
52
-
53
-
54
-
55
-
56
-
57
-
58
-
59
-
60
-
61
-
62
-
63
-
64
-
65
-
66
-
67
-
68
-
69
-
70
-
71
-
72
-
73
-
74
-
75
-
76
-
77
-
78
-
79
-
80
-
81
-
82
-
83
-
84
-
85
-
86
-
87
 |
 |

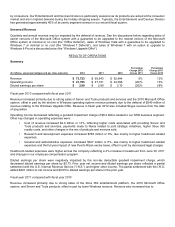
Fiscal year 2012 compared with fiscal year 2011
Windows Division revenue reflected relative performance in PC market segments. We estimate that sales of PCs to
businesses grew approximately 4% and sales of PCs to consumers decreased 1%. Excluding a decline in sales of
netbooks, we estimate that sales of PCs to consumers grew approximately 5%. Taken together, the total PC market
increased an estimated 0% to 2%. Relative to PC market growth, Windows Division revenue was negatively impacted by
higher growth in emerging markets, where average selling prices are lower than developed markets, and the deferral of
$540 million of revenue relating to the Windows Upgrade Offer.
Windows Division operating income decreased, due mainly to lower revenue and a $163 million or 10% increase in
research and development expenses, primarily associated with the Windows 8 operating system.
Fiscal year 2011 compared with fiscal year 2010
Windows Division revenue reflected relative performance in PC market segments. We estimate that sales of PCs to
businesses grew approximately 11% this year and sales of PCs to consumers declined approximately 1%. The decline in
consumer PC sales included an approximately 32% decline in the sales of netbooks. Taken together, the total PC market
increased an estimated 2% to 4%. Revenue was negatively impacted by the effect of higher growth in emerging markets,
where average selling prices are lower, relative to developed markets, and by lower recognition of previously deferred
Windows XP revenue. Considering the impact of the Windows 7 launch in the prior year, including $273 million of revenue
recognized related to the Windows 7 Deferral, we estimate that Windows Division revenue was in line with the PC market.
Windows Division operating income decreased as a result of decreased revenue and higher sales and marketing
expenses. Sales and marketing expenses increased $182 million or 6%, reflecting increased advertising of Windows and
Windows Live.
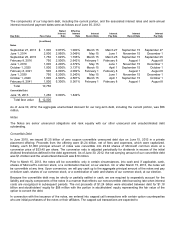
Server and Tools
(In millions, except percentages)
2012
2011
2010
Percentage
Change 2012
Versus 2011
Percentage
Change 2011
Versus 2010
Revenue
$
18,686
$
16,680
$
15,109
12%
10%
Operating income
$
7,431
$
6,290
$
5,381
18%
17%
Server and Tools develops and markets technology and related services that enable information technology professionals
and their systems to be more productive and efficient. Server and Tools product and service offerings include Windows
Server, Microsoft SQL Server, Windows Azure, Visual Studio, System Center products, Windows Embedded device
platforms, and Enterprise Services. Enterprise Services comprise Premier product support services and Microsoft
Consulting Services. We also offer developer tools, training, and certification. Approximately 55% of Server and Tools
revenue comes primarily from multi-year volume licensing agreements, approximately 25% is purchased through
transactional volume licensing programs, retail packaged product and licenses sold to OEMs, and the remainder comes
from Enterprise Services.
Fiscal year 2012 compared with fiscal year 2011
Server and Tools revenue increased in both product sales and Enterprise Services. Product revenue increased $1.4
billion or 11%, driven primarily by growth in SQL Server, Windows Server, and System Center, reflecting continued
adoption of the Windows platform. Enterprise Services revenue grew $595 million or 18%, due to growth in both Premier
product support and consulting services.
Server and Tools operating income increased primarily due to revenue growth, offset in part by higher costs of providing
products and services and increased sales and marketing expenses. Cost of revenue increased $682 million or 22%,
primarily reflecting higher Enterprise Services headcount-related costs. Sales and marketing expenses grew $155 million
or 4%, reflecting increased corporate marketing activities.