Microsoft 2012 Annual Report Download - page 23
Download and view the complete annual report
Please find page 23 of the 2012 Microsoft annual report below. You can navigate through the pages in the report by either clicking on the pages listed below, or by using the keyword search tool below to find specific information within the annual report.-
 1
1 -
2
-
3
-
4
-
5
-
6
-
7
-
8
-
9
-
10
-
11
-
12
-
 13
13 -
 14
14 -
 15
15 -
 16
16 -
 17
17 -
 18
18 -
 19
19 -
 20
20 -
 21
21 -
 22
22 -
 23
23 -
 24
24 -
 25
25 -
 26
26 -
 27
27 -
 28
28 -
 29
29 -
 30
30 -
 31
31 -
 32
32 -
 33
33 -
34
-
35
-
36
-
37
-
38
-
39
-
40
-
41
-
42
-
43
-
44
-
45
-
46
-
47
-
48
-
49
-
50
-
51
-
52
-
53
-
54
-
55
-
56
-
57
-
58
-
59
-
60
-
61
-
62
-
63
-
64
-
65
-
66
-
67
-
68
-
69
-
70
-
71
-
72
-
73
-
74
-
75
-
76
-
77
-
78
-
79
-
80
-
81
-
82
-
83
-
84
-
85
-
86
-
87
 |
 |

Fiscal year 2011 compared with fiscal year 2010
Server and Tools revenue increased in both product sales and Enterprise Services. Product revenue increased $1.2
billion or 10%, driven primarily by growth in Windows Server, SQL Server, and System Center, reflecting continued
adoption of the Windows platform. Enterprise Services revenue grew $353 million or 12%, due to growth in both Premier
product support and consulting services.
Server and Tools operating income increased due to revenue growth, offset in part by higher operating expenses. Cost of
revenue increased $377 million or 13%, primarily reflecting a $323 million increase in expenses from providing Enterprise
Services. Sales and marketing expenses increased $270 million or 7%, reflecting increased fees paid to third-party
enterprise software advisors and increased corporate marketing activities.
Online Services Division
(In millions, except percentages)
2012
2011
2010
Percentage
Change 2012
Versus 2011
Percentage
Change 2011
Versus 2010
Revenue
$
2,867
$
2,607
$
2,294
10%
14%
Operating loss
$
(8,121
)
$
(2,657
)
$
(2,408
)
*
(10)%
* Not meaningful
Online Services Division (“OSD”) develops and markets information and content designed to help people simplify tasks
and make more informed decisions online, and that help advertisers connect with audiences. OSD offerings include Bing,
MSN, adCenter, and advertiser tools. Bing and MSN generate revenue through the sale of search and display advertising,
accounting for nearly all of OSD’s annual revenue.
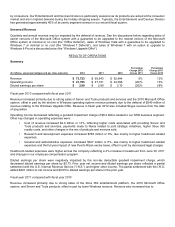
Fiscal year 2012 compared with fiscal year 2011
Online advertising revenue grew $306 million or 13% to $2.6 billion, reflecting continued growth in search advertising
revenue, offset in part by decreased display advertising revenue. Search revenue grew due to increased revenue per
search, increased volumes reflecting general market growth, and share gains in the U.S. According to third-party sources,
Bing organic U.S. market share for the month of June 2012 was approximately 16%, and grew 120 basis points year over
year. Bing-powered U.S. market share, including Yahoo! properties, was approximately 26% for the month of June 2012,
down 100 basis points year over year.
OSD’s fiscal year 2012 operating loss reflects a goodwill impairment charge of $6.2 billion, which we recorded as a result
of our annual goodwill impairment test in the fourth quarter. The non-cash, non-tax-deductible charge related mainly to
goodwill acquired through our 2007 acquisition of aQuantive, Inc. While the search business has been improving, our
expectations for future growth and profitability for OSD are lower than our previous estimates. We do not expect this
impairment charge to affect OSD’s ongoing business or financial performance.
Excluding the $6.2 billion goodwill impairment charge, OSD’s operating loss was reduced by higher revenue and lower
sales and marketing expenses and cost of revenue. Sales and marketing expenses decreased $321 million or 29%, due
mainly to lower marketing spend. Cost of revenue decreased $213 million, driven by lower Yahoo! reimbursement costs,
amortization, and online operating costs.
Fiscal year 2011 compared with fiscal year 2010
OSD revenue increased primarily as a result of growth in online advertising revenue. Online advertising revenue grew
$351 million or 18% to $2.3 billion, reflecting continued growth in search and display advertising revenue, offset in part by
decreased third-party advertising revenue. Search revenue grew due to increased volumes reflecting general market
growth, share gains in the U.S., and our Yahoo! alliance, offset in part by decreased revenue per search primarily related
to challenges associated with optimizing the adCenter platform for the new mix and volume