Microsoft 2012 Annual Report Download - page 25
Download and view the complete annual report
Please find page 25 of the 2012 Microsoft annual report below. You can navigate through the pages in the report by either clicking on the pages listed below, or by using the keyword search tool below to find specific information within the annual report.-
 1
1 -
2
-
3
-
4
-
5
-
6
-
7
-
8
-
9
-
10
-
11
-
12
-
13
-
14
-
 15
15 -
 16
16 -
 17
17 -
 18
18 -
 19
19 -
 20
20 -
 21
21 -
 22
22 -
 23
23 -
 24
24 -
 25
25 -
 26
26 -
 27
27 -
 28
28 -
 29
29 -
 30
30 -
 31
31 -
 32
32 -
 33
33 -
 34
34 -
 35
35 -
36
-
37
-
38
-
39
-
40
-
41
-
42
-
43
-
44
-
45
-
46
-
47
-
48
-
49
-
50
-
51
-
52
-
53
-
54
-
55
-
56
-
57
-
58
-
59
-
60
-
61
-
62
-
63
-
64
-
65
-
66
-
67
-
68
-
69
-
70
-
71
-
72
-
73
-
74
-
75
-
76
-
77
-
78
-
79
-
80
-
81
-
82
-
83
-
84
-
85
-
86
-
87
 |
 |

marketing expenses increased, primarily driven by an increase in corporate and cross-platform marketing activities.
Research and development costs increased, primarily as a result of capitalization of certain Microsoft Office system
software development costs in the prior year.
Entertainment and Devices Division
(In millions, except percentages)
2012
2011
2010
Percentage
Change 2012
Versus 2011
Percentage
Change 2011
Versus 2010
Revenue
$
9,593
$
8,915
$
6,079
8%
47%
Operating income
$
364
$
1,257
$
517
(71)%
143%
Entertainment and Devices Division (“EDD”) develops and markets products and services designed to entertain and
connect people. EDD offerings include the Xbox 360 entertainment platform (which includes the Xbox 360 gaming and
entertainment console, Kinect for Xbox 360, Xbox 360 video games, Xbox LIVE, and Xbox 360 accessories), Mediaroom
(our Internet protocol television software), Skype, and Windows Phone, including related patent licensing revenue. In
November 2010, we released Kinect for Xbox 360. We acquired Skype on October 13, 2011, and its results of operations
from that date are reflected in our results discussed below.
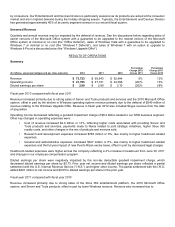
Fiscal year 2012 compared with fiscal year 2011
EDD revenue increased primarily reflecting Skype and Windows Phone revenue, offset in part by lower Xbox 360 platform
revenue. Xbox 360 platform revenue decreased $113 million, due mainly to decreased volumes of Kinect for Xbox 360
sold and lower video game revenue, offset in part by higher Xbox LIVE revenue. We shipped 13.0 million Xbox 360
consoles during fiscal year 2012, compared with 13.7 million Xbox 360 consoles during fiscal year 2011. Video game
revenue decreased due to strong sales of Halo Reach in the prior year.
EDD operating income decreased reflecting higher operating expenses, offset in part by revenue growth. Cost of revenue
grew $900 million or 16%, primarily due to changes in the mix of products and services sold and payments made to Nokia
related to joint strategic initiatives. Research and development expenses increased $356 million or 30%, primarily
reflecting higher headcount-related expenses. Sales and marketing expenses increased $244 million or 28%, primarily
reflecting the inclusion of Skype expenses.
Fiscal year 2011 compared with fiscal year 2010
EDD revenue increased primarily reflecting higher Xbox 360 platform revenue. Xbox 360 platform revenue grew $2.7
billion or 48%, led by increased volumes of Xbox 360 consoles, sales of Kinect for Xbox 360, and higher Xbox LIVE
revenue. We shipped 13.7 million Xbox 360 consoles during fiscal year 2011, compared with 10.3 million Xbox 360
consoles during fiscal year 2010.
EDD operating income increased primarily reflecting revenue growth, offset in part by higher cost of revenue. Cost of
revenue increased $1.8 billion or 49%, primarily reflecting higher volumes of Xbox 360 consoles and Kinect for Xbox 360
sold, and increased royalty costs resulting from increased sales of Xbox LIVE digital content. Research and development
expenses increased $160 million or 15%, primarily reflecting higher headcount-related costs. Sales and marketing
expenses grew $112 million or 15%, primarily reflecting increased Xbox 360 platform marketing activities.
Corporate-Level Activity
(In millions, except percentages)
2012
2011
2010
Percentage
Change 2012
Versus 2011
Percentage
Change 2011
Versus 2010
Corporate-level activity
$
(5,090
)
$
(4,597
)
$
(4,136
)
(11)%
(11)%