Microsoft 2012 Annual Report Download - page 24
Download and view the complete annual report
Please find page 24 of the 2012 Microsoft annual report below. You can navigate through the pages in the report by either clicking on the pages listed below, or by using the keyword search tool below to find specific information within the annual report.-
 1
1 -
2
-
3
-
4
-
5
-
6
-
7
-
8
-
9
-
10
-
11
-
12
-
13
-
 14
14 -
 15
15 -
 16
16 -
 17
17 -
 18
18 -
 19
19 -
 20
20 -
 21
21 -
 22
22 -
 23
23 -
 24
24 -
 25
25 -
 26
26 -
 27
27 -
 28
28 -
 29
29 -
 30
30 -
 31
31 -
 32
32 -
 33
33 -
 34
34 -
35
-
36
-
37
-
38
-
39
-
40
-
41
-
42
-
43
-
44
-
45
-
46
-
47
-
48
-
49
-
50
-
51
-
52
-
53
-
54
-
55
-
56
-
57
-
58
-
59
-
60
-
61
-
62
-
63
-
64
-
65
-
66
-
67
-
68
-
69
-
70
-
71
-
72
-
73
-
74
-
75
-
76
-
77
-
78
-
79
-
80
-
81
-
82
-
83
-
84
-
85
-
86
-
87
 |
 |

of traffic from the combined Yahoo! and Bing properties. According to third-party sources, Bing organic U.S. market share
for the month of June 2011 was approximately 14%, and grew 170 basis points year over year. Bing-powered U.S. market
share, including Yahoo! properties, was approximately 27% for the month of June 2011.
OSD operating loss increased due to higher operating expenses, offset in part by increased revenue. Cost of revenue
grew $647 million driven by costs associated with the Yahoo! search agreement and increased traffic acquisition costs.
General and administrative expenses decreased $156 million or 58%, due mainly to transition expenses in the prior year
associated with the inception of the Yahoo! Commercial Agreement. Research and development increased $123 million or
11% due to increased headcount-related costs.
Microsoft Business Division
(In millions, except percentages)
2012
2011
2010
Percentage
Change 2012
Versus 2011
Percentage
Change 2011
Versus 2010
Revenue
$
23,991
$
22,514
$
19,256
7%
17%
Operating income
$
15,719
$
14,657
$
11,849
7%
24%
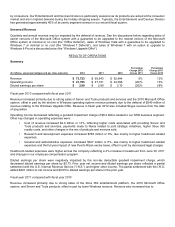
Microsoft Business Division (“MBD”) develops and markets software and online services designed to increase personal,
team, and organization productivity. MBD offerings include the Microsoft Office system (comprising mainly Office,
SharePoint, Exchange, Lync, and Office 365), which generates over 90% of MBD revenue, and Microsoft Dynamics
business solutions. We evaluate MBD results based upon the nature of the end user in two primary parts: business
revenue, which includes Microsoft Office system revenue generated through volume licensing agreements and Microsoft
Dynamics revenue; and consumer revenue, which includes revenue from retail packaged product sales and OEM
revenue.
Fiscal year 2012 compared with fiscal year 2011
MBD revenue increased primarily reflecting sales of the 2010 Microsoft Office system. Business revenue increased
$1.7 billion or 9%, primarily reflecting growth in multi-year volume licensing revenue, licensing of the 2010 Microsoft Office
system to transactional business customers, and an 11% increase in Microsoft Dynamics revenue. Consumer revenue
decreased $195 million or 4% due to the recognition of $254 million of revenue in the prior year associated with the Office
Deferral. Excluding the fiscal year 2011 impact associated with the Office Deferral, consumer revenue increased $59
million, driven by increased sales of the 2010 Microsoft Office system.
MBD revenue for the year ended June 30, 2012 included a favorable foreign currency impact of $506 million.
MBD operating income increased, primarily due to revenue growth, offset in part by higher operating expenses. Cost of
revenue increased $258 million or 16%, primarily due to higher online operation and support costs. Research and
development expenses increased, due mainly to an increase in headcount-related costs.
Fiscal year 2011 compared with fiscal year 2010
MBD revenue increased primarily reflecting sales of the 2010 Microsoft Office system, the $254 million Office Deferral
during fiscal year 2010, and the subsequent recognition of the Office Deferral during fiscal year 2011. Business revenue
increased $2.1 billion or 14%, reflecting licensing of the 2010 Microsoft Office system to transactional business
customers, growth in multi-year volume licensing revenue, and a 10% increase in Microsoft Dynamics revenue. Consumer
revenue increased $1.1 billion or 33%, approximately half of which was attributable to the launch of Office 2010 and half
of which was attributable to the Office Deferral during fiscal year 2010 and subsequent recognition of the Office Deferral
during fiscal year 2011. Excluding the impact associated with the Office Deferral, consumer revenue increased $617
million or 17% due to sales of the 2010 Microsoft Office system.
MBD operating income increased due mainly to revenue growth, offset in part by higher operating expenses. Cost of
revenue increased $328 million or 25%, primarily driven by higher online operation and support costs. Sales and