Safeway 1998 Annual Report Download - page 11
Download and view the complete annual report
Please find page 11 of the 1998 Safeway annual report below. You can navigate through the pages in the report by either clicking on the pages listed below, or by using the keyword search tool below to find specific information within the annual report.-
 1
1 -
 2
2 -
 3
3 -
 4
4 -
 5
5 -
 6
6 -
 7
7 -
 8
8 -
 9
9 -
 10
10 -
 11
11 -
 12
12 -
 13
13 -
 14
14 -
 15
15 -
 16
16 -
 17
17 -
 18
18 -
 19
19 -
 20
20 -
 21
21 -
 22
22 -
23
-
24
-
25
-
26
-
27
-
28
-
29
-
30
-
31
-
32
-
33
-
34
-
35
-
36
-
37
-
38
-
39
-
40
-
41
-
42
-
43
-
44
 |
 |

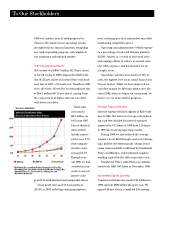
Continued Strong Performance
During 1998, Safeway continued to be among the industry leaders in the
following key measures of financial performance:*
•Identical-store sales growth
•Expense ratio reduction
•Working capital management
•Operating cash flow margin
•Earnings per share growth
The value of Safeway common stock on the New York Stock Exchange at the
close of trading in 1998 rose to $60.94 per share, a gain of 92.7% from year-end
1997. We have achieved these results by focusing on the three priorities detailed
on the following pages.
*Based on latest available information