Safeway 1998 Annual Report Download - page 23
Download and view the complete annual report
Please find page 23 of the 1998 Safeway annual report below. You can navigate through the pages in the report by either clicking on the pages listed below, or by using the keyword search tool below to find specific information within the annual report.-
 1
1 -
2
-
3
-
4
-
5
-
6
-
7
-
8
-
9
-
10
-
11
-
12
-
 13
13 -
 14
14 -
 15
15 -
 16
16 -
 17
17 -
 18
18 -
 19
19 -
 20
20 -
 21
21 -
 22
22 -
 23
23 -
 24
24 -
 25
25 -
 26
26 -
 27
27 -
 28
28 -
 29
29 -
 30
30 -
 31
31 -
 32
32 -
 33
33 -
34
-
35
-
36
-
37
-
38
-
39
-
40
-
41
-
42
-
43
-
44
 |
 |
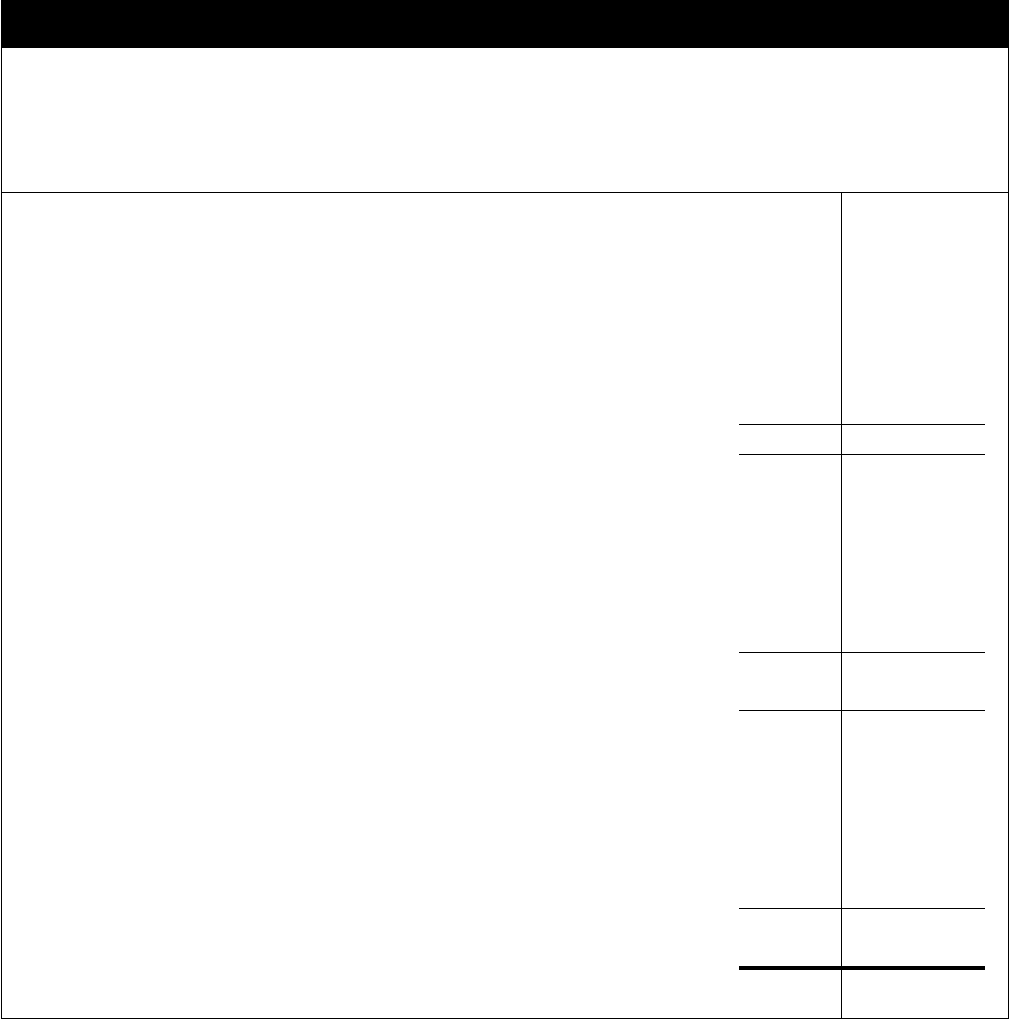
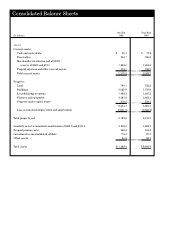
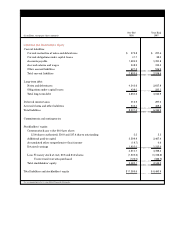
Assets
Current assets:
Cash and equivalents $ 45.7 $ 77.2
Receivables 200.1 180.8
Merchandise inventories, net of LIFO
reserve of $80.2 and $73.1 1,856.0 1,613.2
Prepaid expenses and other current assets 218.1 158.5
■ ■ ■ ■ ■ ■ ■ ■ ■ ■ ■■ ■ ■ ■■ ■ ■ ■ ■
Total current assets 2,319.9 2,029.7
■ ■ ■ ■ ■ ■ ■ ■ ■ ■ ■■ ■ ■ ■■ ■ ■ ■ ■
Property:
Land 794.1 722.2
Buildings 2,069.9 1,719.9
Leasehold improvements 1,498.3 1,247.3
Fixtures and equipment 3,282.6 2,663.1
Property under capital leases 379.2 329.2
■ ■ ■ ■ ■ ■ ■ ■ ■ ■ ■■ ■ ■ ■■ ■ ■ ■ ■
8,024.1 6,681.7
Less accumulated depreciation and amortization (2,841.5) (2,566.4)
■ ■ ■ ■ ■ ■ ■ ■ ■ ■ ■■ ■■ ■ ■ ■ ■ ■ ■
Total property, net 5,182.6 4,115.3
Goodwill, net of accumulated amortization of $211.0 and $157.0 3,348.0 1,824.7
Prepaid pension costs 369.6 341.4
Investment in unconsolidated affiliate 115.2 97.7
Other assets 54.3 85.1
■ ■ ■ ■ ■ ■ ■ ■ ■ ■ ■■ ■ ■ ■■ ■ ■ ■ ■
Total assets $11,389.6 $8,493.9
■ ■ ■ ■ ■ ■ ■ ■ ■ ■ ■ ■ ■ ■ ■ ■ ■ ■ ■ ■
Year-End Year-End
(In millions) 1998 1997
Consolidated Balance Sheets