Safeway 1998 Annual Report Download - page 5
Download and view the complete annual report
Please find page 5 of the 1998 Safeway annual report below. You can navigate through the pages in the report by either clicking on the pages listed below, or by using the keyword search tool below to find specific information within the annual report.-
 1
1 -
 2
2 -
 3
3 -
 4
4 -
 5
5 -
 6
6 -
 7
7 -
 8
8 -
 9
9 -
 10
10 -
 11
11 -
 12
12 -
 13
13 -
 14
14 -
 15
15 -
 16
16 -
17
-
18
-
19
-
20
-
21
-
22
-
23
-
24
-
25
-
26
-
27
-
28
-
29
-
30
-
31
-
32
-
33
-
34
-
35
-
36
-
37
-
38
-
39
-
40
-
41
-
42
-
43
-
44
 |
 |

1998 was another year of solid pro g r ess for
S a f e w a y. We improved our operating re s u l t s ,
strengthened our financial position, steppedup
our capital spending program, and completed
one acquisition and initiated another.
Improved Operating Results
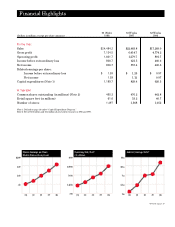
Net income was $806.7 million ($1.59 per share )
in the 52 weeks of 1998 compared to $621.5 mil-
lion ($1.25 per share) of income before extraordi-
nary loss in 1997, a 53-week year. Results in 1997
were adversely affected by an extraordinary loss
of $64.1 million ($0.13 per share), arising fro m
the replacement of higher interest rate debt
with lower-rate debt.
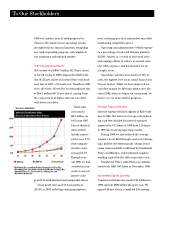
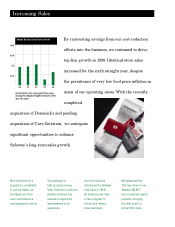
Total sales
increased to
$24.5 billion, u p
8.9% from 1997.
Sales of identical
stores (which
exclude replace-
ments) rose 3.7%,
while compara-
ble-store sales
increased 4.1%.
Through year-
end 1998, we had
recorded six con-
secutive years of
positive sales
growth in both identical and comparable stores.
Gross profit increased 57 basis points to
29.10% in 1998, reflecting continuing improve-
ment in buying practices and product mix while
maintaining competitive prices.
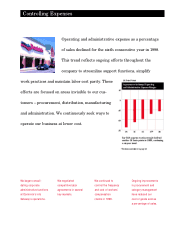
Operating and administrative (O&A) expense
as a percentage of sales fell 28 basis points to
22.56%, largely as a result of increased sales
and ongoing eff o r ts to reduce or control costs.
Our O&A expense ratio has declined for six
straight years.
Operating cash flow increased to 8.75% of
sales, the highest level on an annual basis in our
72-year history. While we have improved our
cash flow margin by 368 basis points since the
end of 1992, when we began our turn a round, we
believe we can make further progress.
Stronger Financial Position
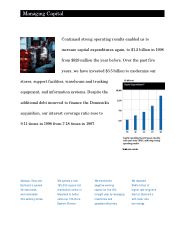
I n t e rest expense declined slightly to $235.0 mil-
lion in 1998. Our interest coverage ratio (operat-
ing cash flow divided by interest expense)
i m p roved to 9.11 times in 1998 from 7.18 times
in 1997 due to strong operating results.
During 1998 we also reduced the average
i n t e rest rate on debt through a series of re f i n a n c-
ings, had the investment grade ratings on our
senior unsecured debt re a ff i rmed by Standard &
Poor’s and Moody’s, and maintained negative
working capital for the fifth consecutive year.
Standard & Poor’s added Safeway common
stock to its S&P 500 Index in November 1998.
Accelerated Capital Spending
Capital investments increased to $1.2 billion in
1998, up from $829 million the prior year. We
opened 46 new stores, remodeled 234 existing
To Our Stockholders