Safeway 1998 Annual Report Download - page 17
Download and view the complete annual report
Please find page 17 of the 1998 Safeway annual report below. You can navigate through the pages in the report by either clicking on the pages listed below, or by using the keyword search tool below to find specific information within the annual report.-
 1
1 -
2
-
3
-
4
-
5
-
6
-
 7
7 -
 8
8 -
 9
9 -
 10
10 -
 11
11 -
 12
12 -
 13
13 -
 14
14 -
 15
15 -
 16
16 -
 17
17 -
 18
18 -
 19
19 -
 20
20 -
 21
21 -
 22
22 -
 23
23 -
 24
24 -
 25
25 -
 26
26 -
 27
27 -
28
-
29
-
30
-
31
-
32
-
33
-
34
-
35
-
36
-
37
-
38
-
39
-
40
-
41
-
42
-
43
-
44
 |
 |

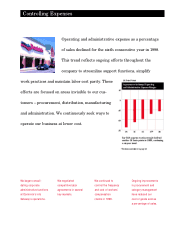
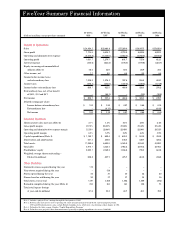
Capital Expenditure Program
A component of Safeway’s long-term strategy is its capital
expenditure program. The Company’s capital expenditure
program funds, among other things, new stores, remodels,
manufacturing plants, distribution facilities, and information
technology advances. In the last several years, Safeway man-
agement has significantly strengthened its program to select
and approve new capital investments, resulting in improved
returns on investment.
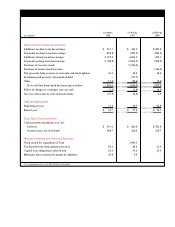
The table below reconciles cash paid for pro p e rty additions
reflected in the Consolidated Statements of Cash Flows to
S a f e w a y ’s broader definition of capital expenditures, and also
details changes in the Company’s store base during such period:
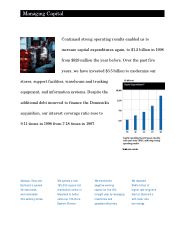
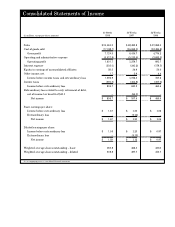
Improved operations and lower project costs have raised
the return on capital projects, allowing Safeway to increase
capital expenditures to $1.2 billion in 1998 and open 46 stores,
remodel 234 stores and complete construction of the new dis-
tribution center in Maryland. In 1999, Safeway expects to
spend approximately $1.2 billion and open 55 to 60 new store s
and complete approximately 250 remodels.
(Dollars in millions) 1998 1997 1996
Cash paid for property
additions $1,075.2 $758.2 $541.8
Less: Purchases of
previously leased
properties (35.7) (28.2) (13.2)
Plus: Present value of all lease
obligations incurred 117.4 91.3 91.7
Mortgage notes assumed
in property acquisitions 32.8 0.9 –
Vons first-quarter
expenditures –7.2 –
■ ■ ■ ■ ■ ■ ■ ■ ■ ■ ■ ■ ■■ ■ ■ ■ ■ ■ ■
Total capital expenditures $1,189.7 $829.4 $620.3
■ ■ ■ ■ ■ ■ ■ ■ ■ ■ ■ ■ ■■ ■ ■ ■ ■ ■ ■
Capital expenditures as
a percent of sales 4.9% 3.7% 3.6%
Dominick’s stores acquired 113 – –
Vons stores acquired –316 –
Stores opened 46 37 30
Stores closed or sold 30 37 37
Remodels (Note 1) 234 181 141
Total retail square footage
at year-end (in millions) 61.6 53.2 40.7
Note 1: Defined as store projects (other than maintenance) generally requiring
expenditures in excess of $200,000.
Performance-Based Compensation
The Company has perf o rmance-based compensation plans
that cover approximately 12,000 management and pro f e s s i o n a l
employees. Perf o rmance-based compensation plans set overall
bonus levels based upon both operating results and working
capital management. Individual bonuses are based on job
p e rf o rmance. Certain employees are covered by capital invest-
ment bonus plans which measure the performance of capital
projects based on operating performance over several years.
Market Risk from Financial Instruments
Safeway manages interest rate risk through the strategic
use of fixed and variable interest rate debt and, to a limited
extent, interest rate derivatives. At year-end 1998,
S a f e w a y ’s derivative instruments consisted of interest rate
cap agreements and an interest rate swap agreement. The
cap agreements expire in May 1999, and entitle Safeway
to receive the excess of LIBOR over 7% on an $850 million
notional amount. Under the swap agreement, which expires
in the year 2007, Safeway pays interest of 6.2% on a $100 mil-
lion notional amount and receives a variable interest rate
based on Federal Reserve rates quoted for commercial paper.
No derivatives are held for trading purposes.
The following table provides information by year of maturi-
ty about the Company’s other financial instruments that are
sensitive to interest rate changes:
(Dollars in millions) 1999 2000 2001 2002 2003 Thereafter
C o m m e rcial paper:
P r i n c i p a l – – – $1 , 7 4 5 . 1 – –
Weighted a v e r a g e
interest rate – – – 5 . 9 9 % – –
Bank borro w i n g s :
P r i n c i p a l $ 1 6 1 . 8 – – $ 8 9 . 1 – –
Weighted average
interest rate 5 . 8 0 % – – 5 . 5 7 % – –
L o n g - t e rm debt:*
P r i n c i p a l $ 1 1 8 . 0 $ 4 2 7 . 5 $ 5 4 9 . 6 $ 3 7 . 8 $ 3 7 7 . 6 $1 , 0 1 5 . 9
Weighted average
interest rate 8 . 9 7 % 5 . 9 3 % 6 . 8 8 % 8 . 9 5 % 6 . 2 8 % 7 . 2 2 %
*Primarily fixed rate debt