Safeway 1998 Annual Report Download - page 22
Download and view the complete annual report
Please find page 22 of the 1998 Safeway annual report below. You can navigate through the pages in the report by either clicking on the pages listed below, or by using the keyword search tool below to find specific information within the annual report.-
 1
1 -
2
-
3
-
4
-
5
-
6
-
7
-
8
-
9
-
10
-
11
-
 12
12 -
 13
13 -
 14
14 -
 15
15 -
 16
16 -
 17
17 -
 18
18 -
 19
19 -
 20
20 -
 21
21 -
 22
22 -
 23
23 -
 24
24 -
 25
25 -
 26
26 -
 27
27 -
 28
28 -
 29
29 -
 30
30 -
 31
31 -
 32
32 -
33
-
34
-
35
-
36
-
37
-
38
-
39
-
40
-
41
-
42
-
43
-
44
 |
 |

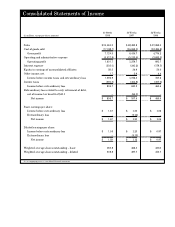
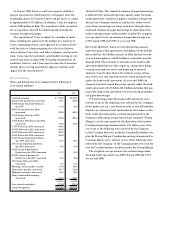
Sales $24,484.2 $ 22,483.8 $ 17,269.0
Cost of goods sold (17,359.7) (16,069.1) (12,494.8)
■ ■ ■ ■ ■ ■ ■ ■ ■ ■ ■ ■ ■ ■ ■ ■ ■ ■ ■ ■ ■ ■ ■ ■ ■ ■ ■ ■
Gross profit 7,124.5 6,414.7 4,774.2
Operating and administrative expense (5,522.8) (5,135.0) (3,882.5)
■ ■ ■ ■ ■ ■ ■ ■ ■ ■ ■ ■ ■ ■ ■ ■ ■ ■ ■ ■ ■ ■ ■ ■ ■ ■ ■ ■
Operating profit 1,601.7 1,279.7 891.7
Interest expense (235.0) (241.2) (178.5)
Equity in earnings of unconsolidated affiliates 28.5 34.9 50.0
Other income, net 1.7 2.9 4.4
■ ■ ■ ■ ■ ■ ■ ■ ■ ■ ■ ■ ■ ■ ■ ■ ■ ■ ■ ■ ■ ■ ■ ■ ■ ■ ■ ■
Income before income taxes and extraordinary loss 1,396.9 1,076.3 767.6
Income taxes (590.2) (454.8) (307.0)
■ ■ ■ ■ ■ ■ ■ ■ ■ ■ ■ ■ ■ ■ ■ ■ ■ ■ ■ ■ ■ ■ ■ ■ ■ ■ ■ ■
Income before extraordinary loss 806.7 621.5 460.6
Extraordinary loss related to early retirement of debt,
net of income tax benefit of $41.1 –(64.1) –
■ ■ ■ ■ ■ ■ ■ ■ ■ ■ ■ ■ ■ ■ ■ ■ ■ ■ ■ ■ ■ ■ ■ ■ ■ ■ ■ ■
Net income $ 806.7 $ 557.4 $ 460.6
■ ■ ■ ■ ■ ■ ■ ■ ■ ■ ■ ■ ■ ■ ■ ■ ■ ■ ■ ■ ■ ■ ■ ■ ■ ■ ■ ■
Basic earnings per share:
Income before extraordinary loss $ 1.67 $ 1.35 $ 1.06
Extraordinary loss –(0.14) –
■ ■ ■ ■ ■ ■ ■ ■ ■ ■ ■ ■ ■ ■ ■ ■ ■ ■ ■ ■ ■ ■ ■ ■ ■ ■ ■ ■
Net income $ 1.67 $ 1.21 $ 1.06
■ ■ ■ ■ ■ ■ ■ ■ ■ ■ ■ ■ ■ ■ ■ ■ ■ ■ ■ ■ ■ ■ ■ ■ ■ ■ ■ ■
Diluted earnings per share:
Income before extraordinary loss $ 1.59 $ 1.25 $ 0.97
Extraordinary loss –(0.13) –
■ ■ ■ ■ ■ ■ ■ ■ ■ ■ ■ ■ ■ ■ ■ ■ ■ ■ ■ ■ ■ ■ ■ ■ ■ ■ ■ ■
Net income $ 1.59 $ 1.12 $ 0.97
■ ■ ■ ■ ■ ■ ■ ■ ■ ■ ■ ■ ■ ■ ■ ■ ■ ■ ■ ■ ■ ■ ■ ■ ■ ■ ■ ■
Weighted average shares outstanding – basic 482.8 462.3 436.0
Weighted average shares outstanding – diluted 508.8 497.7 475.7
52 Weeks 53 Weeks 52 Weeks
(In millions, except per-share amounts) 1998 1997 1996
Consolidated Statements of Income
See accompanying notes to consolidated financial statements.