Safeway 1998 Annual Report Download - page 25
Download and view the complete annual report
Please find page 25 of the 1998 Safeway annual report below. You can navigate through the pages in the report by either clicking on the pages listed below, or by using the keyword search tool below to find specific information within the annual report.-
 1
1 -
2
-
3
-
4
-
5
-
6
-
7
-
8
-
9
-
10
-
11
-
12
-
13
-
14
-
 15
15 -
 16
16 -
 17
17 -
 18
18 -
 19
19 -
 20
20 -
 21
21 -
 22
22 -
 23
23 -
 24
24 -
 25
25 -
 26
26 -
 27
27 -
 28
28 -
 29
29 -
 30
30 -
 31
31 -
 32
32 -
 33
33 -
 34
34 -
 35
35 -
36
-
37
-
38
-
39
-
40
-
41
-
42
-
43
-
44
 |
 |
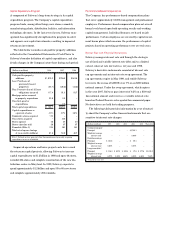
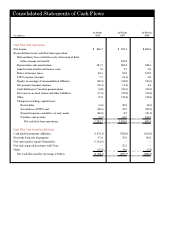
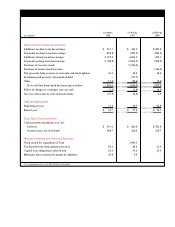
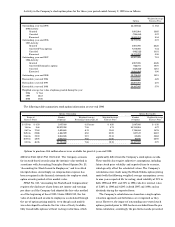
Cash Flow from Operations
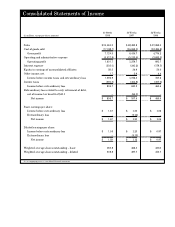
Net income $ 806.7 $ 557.4 $ 460.6
Reconciliation to net cash flow from operations:
Extraordinary loss related to early retirement of debt,
before income tax benefit –105.2 –
Depreciation and amortization 531.4 455.8 338.5
Amortization of deferred finance costs 1.6 1.7 1.8
Deferred income taxes 59.4 55.9 113.9
LIFO expense (income) 7.1 (6.1) 4.9
Equity in earnings of unconsolidated affiliates (28.5) (34.9) (50.0)
Net pension (income) expense (18.3) (4.1) 4.2
Contributions to Canadian pension plans (6.8) (10.0) (10.6)
Decrease in accrued claims and other liabilities (17.5) (13.9) (17.6)
Other 13.3 (12.4) (12.6)
Changes in working capital items:
Receivables (5.5) 25.8 (8.5)
Inventories at FIFO cost (48.0) 37.5 (99.3)
Prepaid expenses and other current assets (36.9) 2.7 (35.1)
Payables and accruals (5.3) 61.0 135.0
■ ■ ■ ■ ■ ■ ■ ■ ■ ■ ■ ■ ■ ■ ■ ■ ■ ■ ■ ■ ■ ■ ■ ■ ■ ■ ■ ■ ■ ■ ■ ■ ■ ■ ■ ■ ■
Net cash flow from operations 1,252.7 1,221.6 825.2
■ ■ ■ ■ ■ ■ ■ ■ ■ ■ ■ ■ ■ ■ ■ ■ ■ ■ ■ ■ ■ ■ ■ ■ ■ ■ ■ ■ ■ ■ ■ ■ ■ ■ ■ ■ ■
Cash Flow from Investing Activities
Cash paid for property additions (1,075.2) (758.2) (541.8)
Proceeds from sale of property 47.6 75.6 60.8
Net cash used to acquire Dominick’s (1,144.9) – –
Net cash acquired in merger with Vons –55.3 –
Other (13.9) 19.6 (1.3)
■ ■ ■ ■ ■ ■ ■ ■ ■ ■ ■ ■ ■ ■ ■ ■ ■ ■ ■ ■ ■ ■ ■ ■ ■ ■ ■ ■ ■ ■ ■ ■ ■ ■ ■ ■ ■
Net cash flow used by investing activities (2,186.4) (607.7) (482.3)
■ ■ ■ ■ ■ ■ ■ ■ ■ ■ ■ ■ ■ ■ ■ ■ ■ ■ ■ ■ ■ ■ ■ ■ ■ ■ ■ ■ ■ ■ ■ ■ ■ ■ ■ ■ ■
52 Weeks 53 Weeks 52 Weeks
(In millions) 1998 1997 1996
Consolidated Statements of Cash Flows