Safeway 1998 Annual Report Download - page 27
Download and view the complete annual report
Please find page 27 of the 1998 Safeway annual report below. You can navigate through the pages in the report by either clicking on the pages listed below, or by using the keyword search tool below to find specific information within the annual report.-
 1
1 -
2
-
3
-
4
-
5
-
6
-
7
-
8
-
9
-
10
-
11
-
12
-
13
-
14
-
15
-
16
-
 17
17 -
 18
18 -
 19
19 -
 20
20 -
 21
21 -
 22
22 -
 23
23 -
 24
24 -
 25
25 -
 26
26 -
 27
27 -
 28
28 -
 29
29 -
 30
30 -
 31
31 -
 32
32 -
 33
33 -
 34
34 -
 35
35 -
 36
36 -
 37
37 -
38
-
39
-
40
-
41
-
42
-
43
-
44
 |
 |

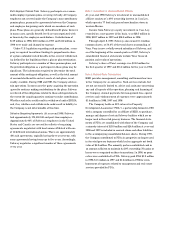
Balance, year-end 1995 427.4 $4.2 $ 682.8 $(196.2) $ 284.4 $ 20.3 $ 795.5
Net income – – – – 460.6 – 460.6 $460.6
Translation adjustments – – – – – (8.3) (8.3) (8.3)
Options and warrants
exercised 15.4 0.2 64.3 – – – 64.5 –
Stock bonuses – – 1.0 – – – 1.0 –
Unexercised warrants
purchased – – – (126.5) – – (126.5) –
■ ■ ■ ■ ■ ■ ■ ■ ■ ■ ■ ■ ■ ■ ■ ■ ■ ■ ■ ■ ■ ■ ■ ■ ■ ■ ■ ■ ■ ■ ■ ■ ■ ■ ■ ■ ■ ■ ■ ■ ■ ■ ■ ■ ■ ■ ■ ■ ■ ■ ■ ■ ■ ■ ■ ■■ ■ ■ ■ ■ ■ ■ ■ ■ ■ ■ ■ ■ ■ ■ ■ ■ ■ ■ ■ ■ ■ ■ ■ ■ ■ ■ ■ ■ ■ ■ ■ ■ ■ ■ ■ ■ ■
Balance, year-end 1996 442.8 4.4 748.1 (322.7) 745.0 12.0 1,186.8 $452.3
Net income – – – – 557.4 557.4 $557.4
Translation adjustments – – – – – (11.4) (11.4) (11.4)
Equity in Vons’ premerger
earnings due to timing
of recording earnings – – – – 12.6 – 12.6 –
Shares issued for
acquisition of Vons 83.2 0.8 1,692.2 – – – 1,693.0 –
Treasury stock purchased – – – (64.0) $(1,376.0) – – – (1,376.0) –
Options and warrants
exercised 11.4 0.1 26.8 2.8 59.4 – – – 86.3 –
Stock bonuses – – 0.3 – – – – – 0.3 –
■ ■ ■ ■ ■ ■ ■ ■ ■ ■ ■ ■ ■ ■ ■ ■ ■ ■ ■ ■ ■ ■ ■ ■ ■ ■ ■ ■ ■ ■ ■ ■ ■ ■ ■ ■ ■ ■ ■ ■ ■ ■ ■ ■ ■ ■ ■ ■ ■ ■ ■ ■ ■ ■ ■ ■ ■ ■ ■ ■ ■ ■ ■ ■ ■ ■ ■ ■ ■ ■ ■ ■ ■ ■ ■ ■ ■
Balance, year-end 1997 537.4 5.3 2,467.4 (61.2) (1,316.6) (322.7) 1,315.0 0.6 2,149.0 $546.0
Net income – – – – – – 806.7 – 806.7 $806.7
Translation adjustments – – – – – – – (20.3) (20.3) (20.3)
Dominick’s options converted – – 27.0 – – – – – 27.0 –
Options and warrants
exercised 13.5 0.2 105.5 0.6 14.0 – – – 119.7 –
Warrants canceled – – – – – 196.7 (196.7) – – –
■ ■ ■ ■ ■ ■ ■ ■ ■ ■ ■ ■ ■ ■ ■ ■ ■ ■ ■ ■ ■ ■ ■ ■ ■ ■ ■ ■ ■ ■ ■ ■ ■ ■ ■ ■ ■ ■ ■ ■ ■ ■ ■ ■ ■ ■ ■ ■ ■ ■ ■ ■ ■ ■ ■ ■ ■ ■ ■ ■ ■ ■ ■ ■ ■ ■ ■ ■ ■ ■ ■ ■ ■ ■ ■ ■ ■
Balance, year-end 1998 550.9 $5.5 $2,599.9 (60.6) $(1,302.6) $(126.0) $1,925.0 $(19.7) $ 3,082.1 $786.4
■ ■ ■ ■ ■ ■ ■ ■ ■ ■ ■ ■ ■ ■ ■ ■ ■ ■ ■ ■ ■ ■ ■ ■ ■ ■ ■ ■ ■ ■ ■ ■ ■ ■ ■ ■ ■ ■ ■ ■ ■ ■ ■ ■ ■ ■ ■ ■ ■ ■ ■ ■ ■ ■ ■ ■ ■ ■ ■ ■ ■ ■ ■ ■ ■ ■ ■ ■ ■ ■ ■ ■ ■ ■ ■ ■ ■
A c c u m u l a t e d
O t h e r
A d d i t i o n a l U n e x e rc i s e d C o m p re h e n s i v e To t a l To t a l
Common Stock P a i d - I n Tre a s u ry Stock Wa rr a n t s R e t a i n e d I n c o m e S t o c k h o l d e r s ’ C o m p re h e n s i v e
■ ■ ■ ■ ■ ■ ■ ■ ■ ■ ■ ■ ■ ■ ■ ■ ■ ■ ■ ■ ■ ■ ■ ■ ■ ■ ■ ■ ■ ■ ■ ■ ■ ■ ■ ■ ■ ■ ■
(In millions) S h a re s A m o u n t C a p i t a l S h a re s C o s t P u rc h a s e d E a rn i n g s ( L o s s ) E q u i t y I n c o m e
Consolidated Statements of Stockholders’ Equity and Comprehensive Income
See accompanying notes to consolidated financial statements.