Safeway 1998 Annual Report Download - page 36
Download and view the complete annual report
Please find page 36 of the 1998 Safeway annual report below. You can navigate through the pages in the report by either clicking on the pages listed below, or by using the keyword search tool below to find specific information within the annual report.-
 1
1 -
2
-
3
-
4
-
5
-
6
-
7
-
8
-
9
-
10
-
11
-
12
-
13
-
14
-
15
-
16
-
17
-
18
-
19
-
20
-
21
-
22
-
23
-
24
-
25
-
 26
26 -
 27
27 -
 28
28 -
 29
29 -
 30
30 -
 31
31 -
 32
32 -
 33
33 -
 34
34 -
 35
35 -
 36
36 -
 37
37 -
 38
38 -
 39
39 -
 40
40 -
 41
41 -
 42
42 -
 43
43 -
 44
44
 |
 |

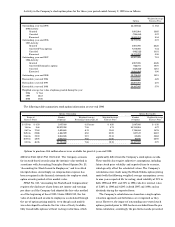
Note H: Employee Benefit Plans and Collective
Bargaining Agreements
Retirement Plans The Company maintains defined benefit,
non-contributory retirement plans for substantially all of its
employees not participating in multi-employer pension plans.
In connection with the Vons Merg e r, the Company assumed
the obligations of Vons’ re t i rement plan. The actuarial assump-
tions for the existing Vons’ re t i rement plan are comparable to the
existing plans of the Company. Vons’ re t i rement plan has been
combined with Safeway’s for financial statement presentation.
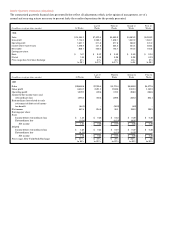
The following tables provide a reconciliation of the changes in
the retirement plans’ benefit obligation and fair value of assets
over the two-year period ended January 2, 1999 and a statement
of the funded status as of year-end 1998 and 1997 (in millions):
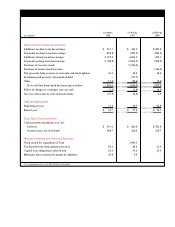
1998 1997
Funded status:
Fair value of plan assets $ 1,766.1 $ 1,662.6
Projected benefit obligation (1,165.7) (1,056.8)
■ ■ ■ ■ ■ ■ ■ ■
Funded status 600.4 605.8
Adjustment for difference in book
and tax basis of assets (165.1) (165.1)
Unamortized prior service cost 95.5 93.7
Unrecognized gain (161.2) (193.0)
■ ■ ■ ■ ■ ■ ■ ■
Prepaid pension cost $ 369.6 $ 341.4
■ ■ ■ ■ ■ ■ ■ ■
1998 1997
Change in fair value of plan assets:
Beginning balance $1,662.6 $1,392.0
Actual return on plan assets 193.2 263.8
Acquisition of Vons –76.5
Employer contributions 6.8 10.0
Benefit payments (79.8) (70.3)
Currency translation adjustments (16.7) (9.4)
■ ■ ■ ■ ■ ■ ■ ■ ■
Ending balance $1,766.1 $1,662.6
■ ■ ■ ■ ■ ■ ■ ■ ■
1998 1997
Change in benefit obligation:
Beginning balance $1,056.8 $ 867.1
Service cost 52.5 42.5
Interest cost 69.7 60.1
Plan amendments 18.2 25.1
Actuarial loss 65.1 45.4
Acquisition of Vons –83.9
Benefit payments (79.8) (70.3)
Change in assumptions (0.5) 12.3
Currency translation adjustments (16.3) (9.3)
■ ■ ■ ■ ■ ■ ■ ■ ■
Ending balance $1,165.7 $1,056.8
■ ■ ■ ■ ■ ■ ■ ■ ■
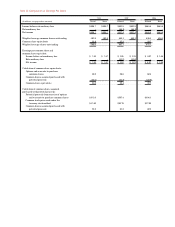
The following table provides the components of 1998 and
1997 net pension income for the re t i rement plans (in millions):
Prior service costs are amortized on a straight-line basis
over the average remaining service period of active part i c i-
pants. Actuarial gains and losses are amortized over the
average remaining service life of active participants when
the accumulation of such gains and losses exceeds 10% of the
g reater of the projected benefit obligation or the fair value
of plan assets.
The actuarial assumptions used to determine year-end plan
status were as follows:
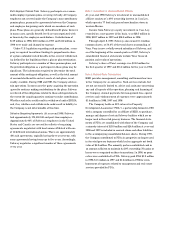
Retirement Restoration Plan The Retirement Restoration Plan
p rovides death benefits and supplemental income payments
for senior executives after re t i r ement. The Company re c o g-
nized expense of $5.0 million in 1998, $4.3 million in 1997 and
$4.4 million in 1996. The aggregate projected benefit obligation
of the Retirement Restoration Plan was approximately $53.8
million at year-end 1998 and $48.4 million at year-end 1997.
1998 1997 1996
Discount rate used to determine
the projected benefit
obligation:
United States Plans 6.5% 7.0% 7.5%
Canadian Plans 6.3 6.3 7.0
Combined weighted
average rate 6.5 6.8 7.4
Expected return on plan assets:
United States Plans 9.0% 9.0% 9.0%
Canadian Plans 8.0 8.0 8.0
Rate of compensation increase:
United States Plans 5.0% 5.0% 5.5%
Canadian Plans 4.5 4.5 5.5
1998 1997 1996
Estimated return on assets $141.5 $118.3 $148.2
Service cost (52.5) (42.5) (41.3)
Interest cost (69.7) (60.1) (51.7)
Amortization of prior
service cost (14.3) (11.6) (56.0)
Amortization of
unrecognized gains 13.3 – –
■ ■ ■ ■ ■■■ ■ ■ ■ ■ ■ ■ ■■ ■
Net pension income $ 18.3 $ 4.1 $ (0.8)
■ ■ ■ ■ ■■■ ■ ■ ■ ■ ■ ■ ■■ ■