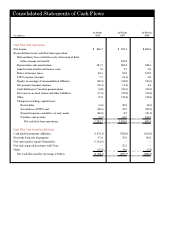
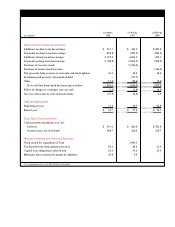
Safeway 1998 Annual Report Download - page 35
Download and view the complete annual report
Please find page 35 of the 1998 Safeway annual report below. You can navigate through the pages in the report by either clicking on the pages listed below, or by using the keyword search tool below to find specific information within the annual report.-
 1
1 -
2
-
3
-
4
-
5
-
6
-
7
-
8
-
9
-
10
-
11
-
12
-
13
-
14
-
15
-
16
-
17
-
18
-
19
-
20
-
21
-
22
-
23
-
24
-
 25
25 -
 26
26 -
 27
27 -
 28
28 -
 29
29 -
 30
30 -
 31
31 -
 32
32 -
 33
33 -
 34
34 -
 35
35 -
 36
36 -
 37
37 -
 38
38 -
 39
39 -
 40
40 -
 41
41 -
 42
42 -
 43
43 -
 44
44
 |
 |

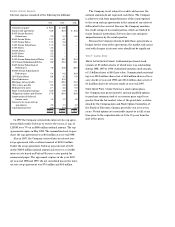
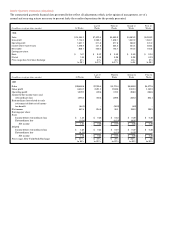
below are not indicative of future period pro forma re s u l t s .
Had compensation cost for Safeway’s stock option plans been
d e t e rmined based on the fair value at the grant date for
a w a rds in 1998, 1997 and 1996, consistent with the provisions
of SFAS No. 123, the Company’s net income and earnings per
s h a re would have been reduced to the pro forma amounts
indicated below:
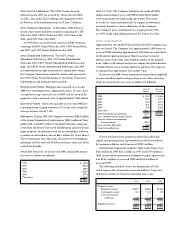
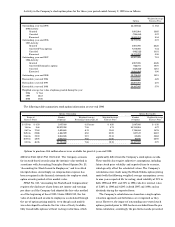
Note G: Taxes on Income
The components of income tax expense are as follows
(in millions):
Extraordinary losses are presented net of related tax
benefits. Therefore, 1997 income tax expense excludes the
$41.1 million tax benefit on an extraordinary loss related to
the early retirement of debt. Tax benefits from the exercise of
employee stock options of $85.2 million in 1998, $42.4 million in
1997 and $51.9 million in 1996 were credited directly to paid-in
capital and, therefore, are excluded from income tax expense.
1998 1997 1996
Current:
Federal $398.8 $303.6 $162.9
State 80.0 57.5 30.7
Foreign 52.0 37.8 (0.5)
■ ■ ■ ■ ■ ■ ■ ■ ■ ■ ■ ■ ■ ■ ■ ■ ■ ■ ■ ■
530.8 398.9 193.1
■ ■ ■ ■ ■ ■ ■ ■ ■ ■ ■ ■ ■ ■ ■ ■ ■ ■■ ■
Deferred:
Federal 44.4 40.4 49.3
State 12.2 8.4 12.6
Foreign 2.8 7.1 52.0
■ ■ ■ ■ ■ ■ ■ ■ ■ ■ ■ ■ ■ ■ ■ ■ ■ ■ ■ ■
59.4 55.9 113.9
■ ■ ■ ■ ■ ■ ■ ■ ■ ■ ■ ■ ■ ■ ■ ■ ■ ■ ■ ■
$590.2 $454.8 $307.0
■ ■ ■ ■ ■ ■ ■ ■ ■ ■ ■ ■ ■ ■ ■ ■ ■ ■ ■ ■
1998 1997 1996
Net income (in millions):
As reported $ 806.7 $557.4 $460.6
Pro forma 794.8 553.5 459.0
Basic earnings per share:
As reported $ 1.67 $ 1.21 $ 1.06
Pro forma 1.65 1.20 1.05
Diluted earnings per share:
As reported $ 1.59 $ 1.12 $ 0.97
Pro forma 1.56 1.11 0.96
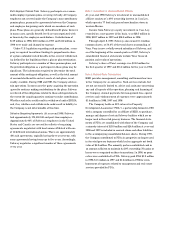
The reconciliation of the provision for income taxes at
the U.S. federal statutory income tax rate to the Company’s
income taxes is as follows (dollars in millions):
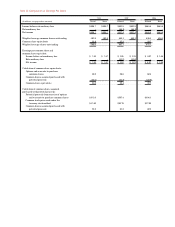
Significant components of the Company’s net deferred tax
liability at year-end were as follows (in millions):
Deferred tax assets include net operating losses assumed in
the Dominick’s acquisition which will expire between 2008 and
2010. Such losses are expected to be fully utilized.
1998 1997 1996
Deferred tax assets:
Workers’ compensation
and other claims $ 158.5 $ 138.8 $ 91.7
Accruals not currently
deductible 106.6 80.3 48.7
Accrued claims and other
liabilities 48.0 48.8 47.4
Employee benefits 34.7 18.4 9.7
U.S. operating loss carry
forward 12.1 – –
Canadian operating loss
carryforward –– 2.7
Other assets 51.5 14.6 6.0
■ ■ ■ ■ ■ ■ ■ ■ ■ ■ ■ ■ ■ ■ ■ ■■ ■
411.4 300.9 206.2
■ ■ ■ ■ ■ ■ ■ ■ ■ ■ ■ ■ ■ ■ ■ ■ ■ ■
Deferred tax liabilities:
Property (315.7) (280.8) (110.5)
Prepaid pension costs (166.4) (161.3) (149.9)
LIFO inventory reserves (125.7) (106.0) (66.8)
Investments in unconsolidated
affiliates (16.7) (15.3) (48.1)
Cumulative translation
adjustments (3.8) (16.2) (23.0)
Other liabilities –(18.3) (31.7)
■ ■ ■ ■ ■ ■ ■ ■ ■ ■ ■ ■ ■ ■ ■ ■ ■ ■
(628.3) (597.9) (430.0)
■ ■ ■ ■ ■ ■ ■ ■ ■ ■ ■ ■ ■ ■ ■ ■ ■ ■
Net deferred tax liability $(216.9) $(297.0) $(223.8)
■ ■ ■ ■ ■ ■ ■ ■ ■ ■ ■ ■ ■ ■ ■ ■ ■ ■
1998 1997 1996
Statutory rate 35% 35% 35%
Income tax expense using
federal statutory rate $488.9 $376.7 $268.7
State taxes on income net
of federal benefit 59.9 42.8 28.1
Taxes provided on equity in
earnings of unconsolidated
affiliates at rates below
the statutory rate (10.0) (9.4) (10.5)
Taxes on foreign earnings
not permanently reinvested 7.9 8.9 7.3
Nondeductible expenses and
amortization 17.6 13.6 3.2
Difference between statutory rate
and foreign effective rate 11.1 10.6 11.1
Other accruals 14.8 11.6 (0.9)
■ ■ ■ ■ ■ ■ ■ ■ ■ ■ ■ ■ ■ ■ ■ ■ ■ ■ ■ ■
$590.2 $454.8 $307.0
■ ■ ■ ■ ■ ■ ■ ■ ■ ■ ■ ■ ■ ■ ■ ■ ■ ■ ■ ■