Safeway 1998 Annual Report Download - page 19
Download and view the complete annual report
Please find page 19 of the 1998 Safeway annual report below. You can navigate through the pages in the report by either clicking on the pages listed below, or by using the keyword search tool below to find specific information within the annual report.-
 1
1 -
2
-
3
-
4
-
5
-
6
-
7
-
8
-
 9
9 -
 10
10 -
 11
11 -
 12
12 -
 13
13 -
 14
14 -
 15
15 -
 16
16 -
 17
17 -
 18
18 -
 19
19 -
 20
20 -
 21
21 -
 22
22 -
 23
23 -
 24
24 -
 25
25 -
 26
26 -
 27
27 -
 28
28 -
 29
29 -
30
-
31
-
32
-
33
-
34
-
35
-
36
-
37
-
38
-
39
-
40
-
41
-
42
-
43
-
44
 |
 |

Financial Review
Acquisition of Dominick’s
Supermarkets, Inc.
(“ Dominick’s” )
In November 1998,
Safeway completed its
acquisition of all of the
outstanding shares of
Dominick’s for $49 cash
per share, or a total of
approximately $1.2 bil-
lion (the “Dominick’s
Acquisition”). Dominick’s
is the second largest
supermarket operator
in the Chicago metropoli-
tan area with 114 stores, two distribution facilities and a dairy
processing plant. Safeway funded the Dominick’s Acquisition,
including the repayment of approximately $560 million of debt
and lease obligations, with a combination of bank borro w i n g s
and commercial paper. Sales for fiscal 1998 were $2.4 billion.
Merger with The Vons Companies, Inc. (“ Vons” )
In April 1997, Safeway completed a merger with Vons pur-
suant to which the Company issued 83.2 million shares of
Safeway common stock for all of the shares of Vons common
stock that it did not already own (the “Vons Merger”).
In connection with the Vons Merger, Safeway repurchased
64.0 million shares of its common stock from a part n e r s h i p
affiliated with KKR &
Co., L.L.C. at $21.50 per
s h a re, for an aggre g a t e
purchase price of $1.376
billion. Safeway funded
the re p u rchase with
bank borrowings.
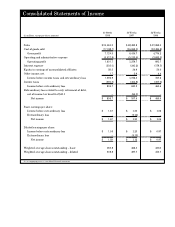
Results of Operations
Safeway’s net income was
$806.7 million ($1.59 per
s h a re) in 1998, $557.4 mil-
lion ($1.12 per share) in
1997 and $460.6 million
($0.97 per share) in 1996.
In 1997, income before an
e x t r a o rd i n a ry item related to debt refinancing was $621.5 mil-
lion ($1.25 per share).
S a f e w a y ’s 1998 income statement includes Vons’ operating
results for the full year and Dominick’s operating results since
a p p roximately midway through Safeway’s fourth quart e r.
S a f e w a y ’s 1997 income statement includes Vons’ operating
results since the second quarter plus the effect of Safeway’s
34.4% equity interest in Vons in the first quarter of 1997.
The 1996 income statement reflects Safeway’s 34.4% equity
i n t e rest in Vons for the full year. In order to facilitate an
understanding of the Company’s operations, this financial
review presents certain pro forma information based on the
1997 and 1996 combined historical financial statements as if
the Vons Merger had been effective as of the beginning of 1997
and 1996. See Note B to the Company’s 1998 consolidated
financial statements.
During the second quarter of 1997, Safeway was engaged
in a 75-day labor dispute affecting 74 stores in the Albert a ,
Canada operating area. The Company estimates that the strike
reduced 1997 net income by approximately $0.04 per share .
Labor disputes in the British Columbia and Denver operating
a reas reduced 1996 net income by an estimated $0.07 per share.
Sales S t rong store operations helped to increase identical-store
sales (stores operating the entire year in both 1998 and 1997,
excluding replacement stores) 3.7% in 1998, while comparable-
store sales, which includes replacement stores, increased 4.1%.
In 1997, identical-store sales increased 1.3% while comparable-
store sales increased 2.2%. Total sales for the 52 weeks of 1998
w e r e $24.5 billion, compared to $22.5 billion for the 53 weeks
of 1997 and $17.3 billion for the 52 weeks of 1996. Total sales
i n c reases are attributed to comparable-store sales increases, the
Vons Merger in 1997, and the Dominick’s Acquisition in 1998.
Gross Profit Safeway’s continuing improvement in buying
practices and product mix helped to increase gross profit to
29.10% of sales in 1998, from 28.53% in 1997 and 27.65% in
1996. On a pro forma basis, gross profit increased to 28.63% in
1997 from 28.20% in 1996. Application of the LIFO method
resulted in an increase in cost of goods sold of $7.1 million in
1998, a decrease of $6.1 million in 1997, and an increase of
$4.9 million in 1996.
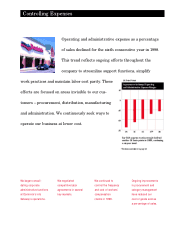
Operating and Administrative Expense Operating and administra-
tive expense was 22.56% of sales in 1998 compared to 22.84% in
1997 and 22.48% in 1996. Safeway’s operating and administra-
tive expense-to-sales ratio increased in 1997 because Vo n s ’