Safeway 1998 Annual Report Download - page 20
Download and view the complete annual report
Please find page 20 of the 1998 Safeway annual report below. You can navigate through the pages in the report by either clicking on the pages listed below, or by using the keyword search tool below to find specific information within the annual report.-
 1
1 -
2
-
3
-
4
-
5
-
6
-
7
-
8
-
9
-
 10
10 -
 11
11 -
 12
12 -
 13
13 -
 14
14 -
 15
15 -
 16
16 -
 17
17 -
 18
18 -
 19
19 -
 20
20 -
 21
21 -
 22
22 -
 23
23 -
 24
24 -
 25
25 -
 26
26 -
 27
27 -
 28
28 -
 29
29 -
 30
30 -
31
-
32
-
33
-
34
-
35
-
36
-
37
-
38
-
39
-
40
-
41
-
42
-
43
-
44
 |
 |
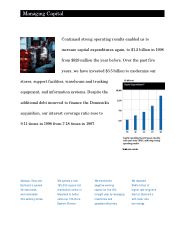
operating and administrative expense ratio had historically
been higher than Safeway’s. Increased sales and ongoing eff o rt s
to reduce or control expenses improved this expense ratio in
1998. Goodwill amortization has increased to $56.3 million in
1998 from $41.8 million in 1997 and $10.4 million in 1996 pri-
marily as a result of the Vons Merg e r. On a pro forma basis,
operating and administrative expense declined 35 basis points
to 22.95% in 1997 from 23.30% in 1996.
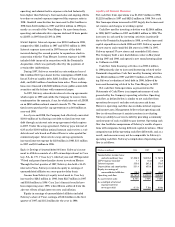
Interest Expense Interest expense was $235.0 million in 1998,
compared to $241.2 million in 1997 and $178.5 million in 1996.
I n t e rest expense increased in 1997 because of the debt
i n c u rred during the second quarter to re p u rchase stock in
connection with the Vons Merg e r. Interest expense in 1998
included debt incurred in connection with the Dominick’s
Acquisition, which was partially offset by the paydown of
certain other indebtedness.
During 1997, Safeway re c o r ded an extraord i n a ry loss of
$64.1 million ($0.13 per share) for the redemption of $589.0 mil-
lion of Safeway’s public debt, $285.5 million of Vons’ public
debt, and $40.0 million of medium-term notes. These re d e m p-
tions were financed with $600 million of new public senior debt
securities and the balance with commercial paper.
In 1997, Safeway entered into interest rate cap agre e m e n t s
which expire in 1999 and entitle the Company to receive fro m
c o u n t e r p a rties the amounts, if any, by which interest at LIBOR
on an $850 million notional amount exceeds 7%. The unamor-
tized cost to purchase the cap agreements was $0.6 million at
year-end 1998.
As of year-end 1998, the Company had effectively convert e d
$100.0 million of its floating rate debt to fixed interest rate
debt through an interest rate swap agreement which expires
in 2007. Under the swap agreement, Safeway pays interest of
6.2% on the $100.0 million notional amount and receives a vari-
able interest rate based on Federal Reserve rates quoted for
commercial paper. Interest rate swap and cap agreements
increased interest expense by $2.8 million in 1998, $3.3 million
in 1997 and $3.0 million in 1996.
Equity in Earnings of Unconsolidated Affiliates S a f e w a y ’s invest-
ment in affiliates consists of a 49% ownership interest in Casa
L e y, S.A. de C.V. (“Casa Ley”), which at year-end 1998 operated
77 food and general merchandise stores in western Mexico.
Through the first quarter of 1997, Safeway also held a 34.4%
interest in Vons. Safeway re c o rds its equity in earnings of
unconsolidated affiliates on a one-quarter delay basis.
Income from Safeway’s equity investment in Casa Ley
i n c r eased to $28.5 million in 1998, from $22.7 million in 1997
and $18.8 million in 1996. Casa Ley’s financial results have
been improving since 1995, when Mexico suff e r ed from the
adverse effects of high interest rates and inflation.
Equity in earnings of unconsolidated affiliates included
Safeway’s share of Vons’ earnings of $12.2 million in the first
quarter of 1997 and $31.2 million for the year in 1996.
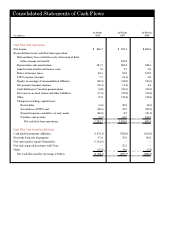
Liquidity and Financial Resources
Net cash flow from operations was $1,252.7 million in 1998,
$1,221.6 million in 1997 and $825.2 million in 1996. Net cash
flow from operations increased in 1997 largely due to incre a s e d
net income and changes in working capital.
Cash flow used by investing activities was $2,186.4 million
in 1998, $607.7 million in 1997 and $482.3 million in 1996. The
i n c reases in cash used by investing activities is primarily
due to the Dominick’s Acquisition in 1998, as well as incre a s e d
capital expenditures in both 1998 and 1997. Safeway opened
46 new stores and remodeled 234 stores in 1998. In 1997,
Safeway opened 37 new stores and remodeled 181 stores.
The Company built a new distribution center in Mary l a n d
during 1997 and 1998, and opened a new manufacturing plant
in California in 1998.
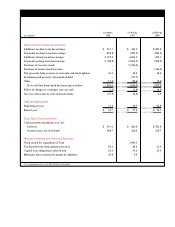
Cash flow from financing activities was $903.4 million
in 1998 primarily due to increased borrowing related to the
D o m i n i c k ’s Acquisition. Cash flow used by financing activities
was $614.6 million in 1997 and $337.5 million in 1996, reflect-
ing Safeway’s reduction of total debt in 1996, followed b y
i n c r eased borrowing related to the Vons Merger in 1997.
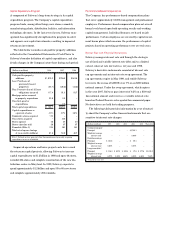
Net cash flow from operations as presented on the
Statements of Cash Flows is an important measure of cash
generated by the Company’s operating activities. Operating
cash flow, as defined below, is similar to net cash flow fro m
operations because it excludes certain non-cash items.
H o w e v e r, operating cash flow also excludes interest expense
and income taxes. Management believes that operating cash
flow is relevant because it assists investors in evaluating
S a f e w a y ’s ability to service its debt by providing a commonly
used measure of cash available to pay interest. Operating cash
flow also facilitates comparisons of Safeway’s results of opera-
tions with companies having diff e rent capital stru c t u res. Other
companies may define operating cash flow diff e re n t l y, and as a
result, such measures may not be comparable to Safeway’s
operating cash flow. Safeway’s computation of operating cash
flow is as follows:
(Dollars in millions) 1998 1997 1996
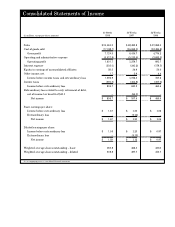
Income before income taxes
and extraordinary loss $ 1,396.9 $1,076.3 $ 767.6
LIFO expense (income) 7.1 (6.1) 4.9
Interest expense 235.0 241.2 178.5
Depreciation and amortization 531.4 455.8 338.5
Equity in earnings of
unconsolidated affiliates (28.5) (34.9) (50.0)
■ ■ ■ ■ ■ ■ ■ ■ ■ ■ ■■ ■■ ■ ■
Operating cash flow $2,141.9 $1,732.3 $1,239.5
■ ■ ■ ■ ■ ■ ■ ■ ■ ■ ■■ ■ ■ ■ ■
As a percent of sales 8.75% 7.70% 7.18%
■ ■ ■ ■ ■ ■ ■ ■ ■ ■ ■ ■ ■ ■ ■ ■
As a multiple of interest
expense (interest
coverage ratio) 9.11x 7.18x 6.94x
■ ■ ■ ■ ■ ■ ■ ■ ■ ■ ■ ■ ■ ■ ■ ■