Safeway 1998 Annual Report Download - page 18
Download and view the complete annual report
Please find page 18 of the 1998 Safeway annual report below. You can navigate through the pages in the report by either clicking on the pages listed below, or by using the keyword search tool below to find specific information within the annual report.-
 1
1 -
2
-
3
-
4
-
5
-
6
-
7
-
 8
8 -
 9
9 -
 10
10 -
 11
11 -
 12
12 -
 13
13 -
 14
14 -
 15
15 -
 16
16 -
 17
17 -
 18
18 -
 19
19 -
 20
20 -
 21
21 -
 22
22 -
 23
23 -
 24
24 -
 25
25 -
 26
26 -
 27
27 -
 28
28 -
29
-
30
-
31
-
32
-
33
-
34
-
35
-
36
-
37
-
38
-
39
-
40
-
41
-
42
-
43
-
44
 |
 |

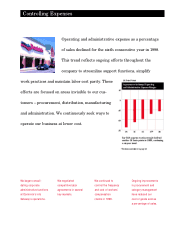
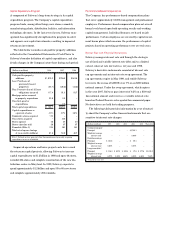
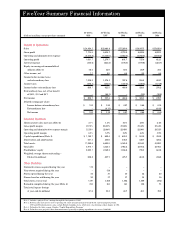
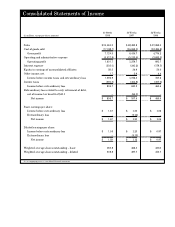
Results of Operations
Sales $24,484.2 $22,483.8 $17,269.0 $16,397.5 $15,626.6
■ ■ ■ ■ ■ ■ ■ ■ ■ ■ ■ ■ ■ ■ ■ ■ ■ ■ ■ ■ ■ ■ ■ ■ ■ ■ ■ ■ ■ ■ ■ ■ ■ ■ ■ ■ ■ ■ ■ ■ ■ ■ ■ ■ ■ ■ ■ ■ ■ ■ ■ ■ ■ ■ ■ ■ ■ ■ ■ ■ ■ ■ ■ ■ ■ ■ ■ ■
Gross profit 7,124.5 6,414.7 4,774.2 4,492.4 4,287.3
Operating and administrative expense (5,522.8) (5,135.0) (3,882.5) (3,765.0) (3,675.2)
■ ■ ■ ■ ■ ■ ■ ■ ■ ■ ■ ■ ■ ■ ■ ■ ■ ■ ■ ■ ■ ■ ■ ■ ■ ■ ■ ■ ■ ■ ■ ■ ■ ■ ■ ■ ■ ■ ■ ■ ■ ■ ■ ■ ■ ■ ■ ■ ■ ■ ■ ■ ■ ■ ■ ■ ■ ■ ■ ■ ■ ■ ■ ■ ■ ■ ■ ■
Operating profit 1,601.7 1,279.7 891.7 727.4 612.1
Interest expense (235.0) (241.2) (178.5) (199.8) (221.7)
Equity in earnings of unconsolidated
affiliates (Note 1) 28.5 34.9 50.0 26.9 27.3
Other income, net 1.7 2.9 4.4 2.0 6.4
■ ■ ■ ■ ■ ■ ■ ■ ■ ■ ■ ■ ■ ■ ■ ■ ■ ■ ■ ■ ■ ■ ■ ■ ■ ■ ■ ■ ■ ■ ■ ■ ■ ■ ■ ■ ■ ■ ■ ■ ■ ■ ■ ■ ■ ■ ■ ■ ■ ■ ■ ■ ■ ■ ■ ■ ■ ■ ■ ■ ■ ■ ■ ■ ■ ■ ■ ■
Income before income taxes
and extraordinary loss 1,396.9 1,076.3 767.6 556.5 424.1
Income taxes (590.2) (454.8) (307.0) (228.2) (173.9)
■ ■ ■ ■ ■ ■ ■ ■ ■ ■ ■ ■ ■ ■ ■ ■ ■ ■ ■ ■ ■ ■ ■ ■ ■ ■ ■ ■ ■ ■ ■ ■ ■ ■ ■ ■ ■ ■ ■ ■ ■ ■ ■ ■ ■ ■ ■ ■ ■ ■ ■ ■ ■ ■ ■ ■ ■ ■ ■ ■ ■ ■ ■ ■ ■ ■ ■ ■
Income before extraordinary loss 806.7 621.5 460.6 328.3 250.2
Extraordinary loss, net of tax benefit
of $41.1, $1.3 and $6.7 –(64.1) – (2.0) (10.5)
■ ■ ■ ■ ■ ■ ■ ■ ■ ■ ■ ■ ■ ■ ■ ■ ■ ■ ■ ■ ■ ■ ■ ■ ■ ■ ■ ■ ■ ■ ■ ■ ■ ■ ■ ■ ■ ■ ■ ■ ■ ■ ■ ■ ■ ■ ■ ■ ■ ■ ■ ■ ■ ■ ■ ■ ■ ■ ■ ■ ■ ■ ■ ■ ■ ■ ■ ■
Net income $ 806.7 $ 557.4 $ 460.6 $ 326.3 $ 239.7
■ ■ ■ ■ ■ ■ ■ ■ ■ ■ ■ ■ ■ ■ ■ ■ ■ ■ ■ ■ ■ ■ ■ ■ ■ ■ ■ ■ ■ ■ ■ ■ ■ ■ ■ ■ ■ ■ ■ ■ ■ ■ ■ ■ ■ ■ ■ ■ ■ ■ ■ ■ ■ ■ ■ ■ ■ ■ ■ ■ ■ ■ ■ ■ ■ ■ ■ ■
Diluted earnings per share:
Income before extraordinary loss $ 1.59 $ 1.25 $ 0.97 $ 0.68 $ 0.51
Extraordinary loss –(0.13) – – (0.02)
■ ■ ■ ■ ■ ■ ■ ■ ■ ■ ■ ■ ■ ■ ■ ■ ■ ■ ■ ■ ■ ■ ■ ■ ■ ■ ■ ■ ■ ■ ■ ■ ■ ■ ■ ■ ■ ■ ■ ■ ■ ■ ■ ■ ■ ■ ■ ■ ■ ■ ■ ■ ■ ■ ■ ■ ■ ■ ■ ■ ■ ■ ■ ■ ■ ■ ■ ■
Net income $ 1.59 $ 1.12 $ 0.97 $ 0.68 $ 0.49
■ ■ ■ ■ ■ ■ ■ ■ ■ ■ ■ ■ ■ ■ ■ ■ ■ ■ ■ ■ ■ ■ ■ ■ ■ ■ ■ ■ ■ ■ ■ ■ ■ ■ ■ ■ ■ ■ ■ ■ ■ ■ ■ ■ ■ ■ ■ ■ ■ ■ ■ ■ ■ ■ ■ ■ ■ ■ ■ ■ ■ ■ ■ ■ ■ ■ ■ ■
Financial Statistics
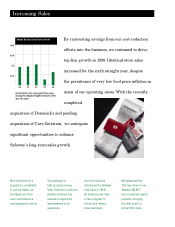
Identical-store sales increases (Note 2) 3.7% 1.3% 5.1% 4.6% 4.4%
Gross profit margin 29.10% 28.53% 27.65% 27.40% 27.44%
Operating and administrative expense margin 22.56% 22.84% 22.48% 22.96% 23.52%
Operating profit margin 6.5% 5.7% 5.2% 4.4% 3.9%
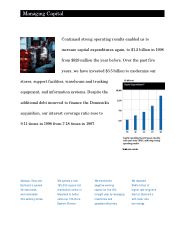
Capital expenditures (Note 3) $ 1,189.7 $ 829.4 $ 620.3 $ 503.2 $ 352.2
Depreciation and amortization 531.4 455.8 338.5 329.7 326.4
Total assets 11,389.6 8,493.9 5,545.2 5,194.3 5,022.1
Total debt 4,972.1 3,340.3 1,984.2 2,190.2 2,196.1
Stockholders’ equity 3,082.1 2,149.0 1,186.8 795.5 643.8
Weighted average shares outstanding –
Diluted (in millions) 508.8 497.7 475.7 481.2 494.2
Other Statistics
Dominick’s stores acquired during the year 113 – – – –
Vons stores acquired during the year –316 – – –
Stores opened during the year 46 37 30 32 20
Stores closed or sold during the year 30 37 37 35 36
Total stores at year-end 1,497 1,368 1,052 1,059 1,062
Remodels completed during the year (Note 4) 234 181 141 108 71
Total retail square footage
at year-end (in millions) 61.6 53.2 40.7 40.1 39.5
52 Weeks 53 Weeks 52 Weeks 52 Weeks 52 Weeks
(Dollars in millions, except per-share amounts) 1998 1997 1996 1995 1994
Note 1. Includes equity in Vons’ earnings through the first quarter of 1997.
Note 2. Reflects sales increases for stores operating the entire measurement period in both the current and prior periods.
1997 and 1996 identical-store sales exclude British Columbia stores, which were closed during a labor dispute in 1996.
Note 3. Defined in the table on page 14 under “Capital Expenditure Program.”
Note 4. Defined as store projects (other than maintenance) generally requiring expenditures in excess of $200,000.
Five-Year Summary Financial Information